
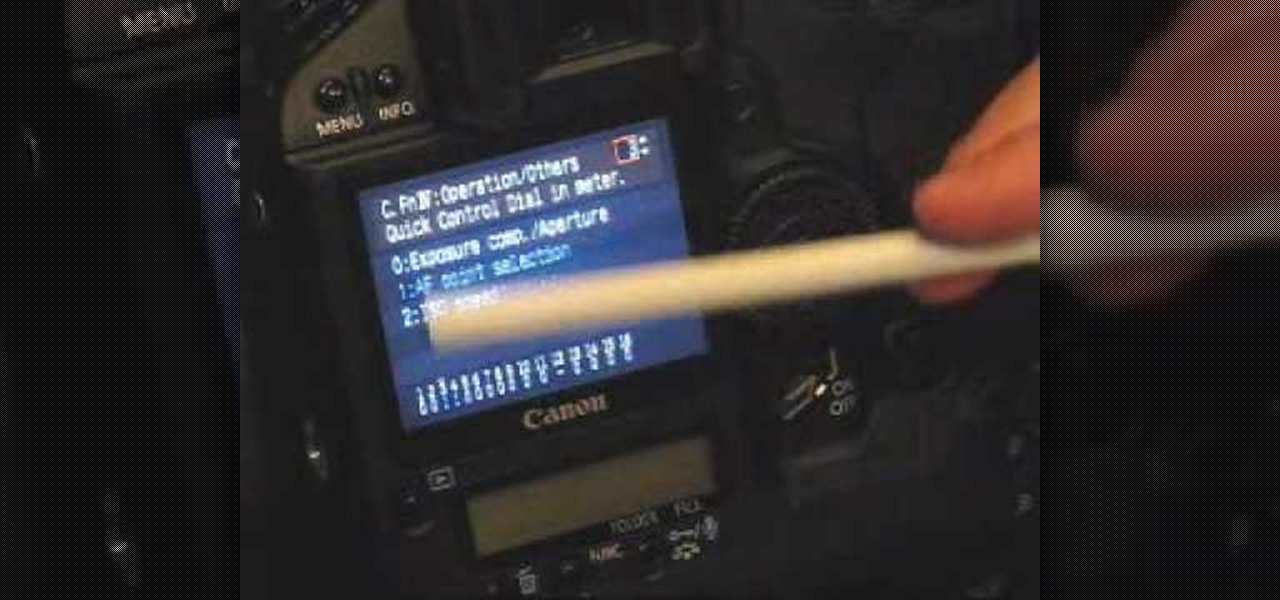
How To: Set up the Canon 1D MKIII camera
Setting up the menu's and Custom Functions of the Canon 1D MKIII camera. Highly technical and boring except for owners of the Canon 1D MKIII who want some insight to setting up this camera.

Setting up the menu's and Custom Functions of the Canon 1D MKIII camera. Highly technical and boring except for owners of the Canon 1D MKIII who want some insight to setting up this camera.
The power button in Vista's start menu doesn't do what you think it should. So why not change it so it does! Find out how in this video from Tekzilla.

This tutorial shows you two examples of how to improve a dark or low-light photo. This video covers the auto Enhance feature, retouch brush tool, Effects menu (Edge Blur) and the Adjust menu (Reduce Noise).
In this tutorial Macmost.com shows iPhoto '08 of the iLife '08 suite. This video demonstrates how to use the Effects Menu and the Adjust menu to improve the quality of you photographs with some simple alterations.
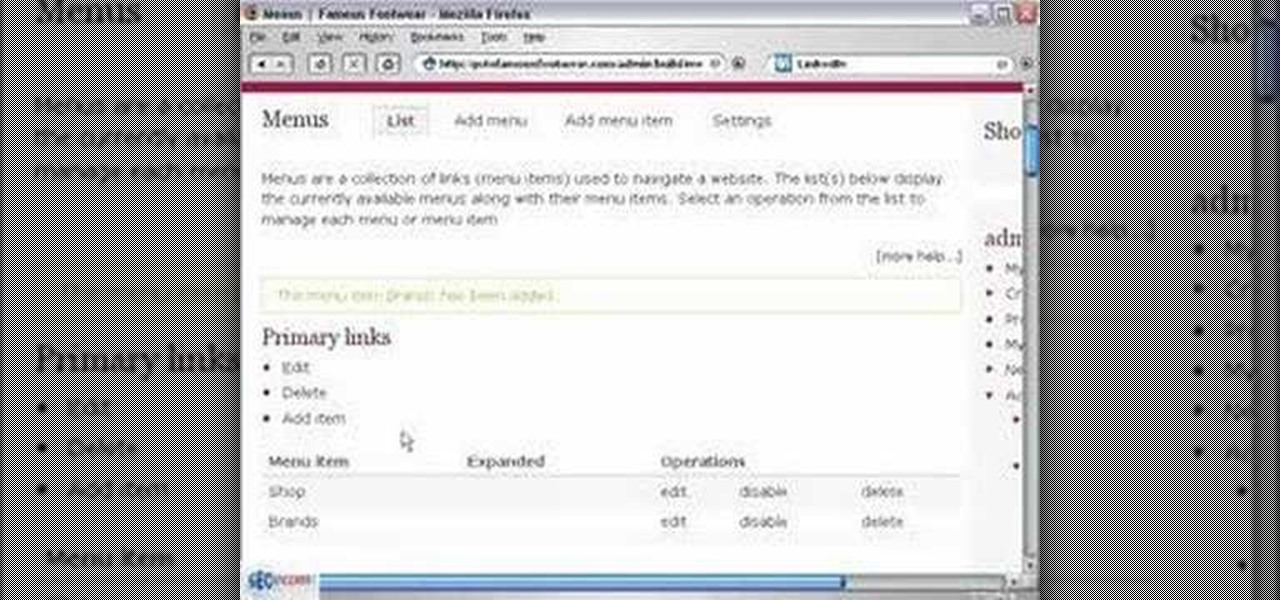
In this video you will see how to create a primary menu in Drupal and connect URLs (paths) to it.

Learn how to make Firefox's interface more minimal by removing the help, view, bookmarks, history, edit, and file menu buttons.

Motion menus integrate seamlessly with DVD Studio Pro. In this tutorial you'll see how to use Motion to make more interesting and complex menus and then add them to your DVD in DVD Studio Pro 4.
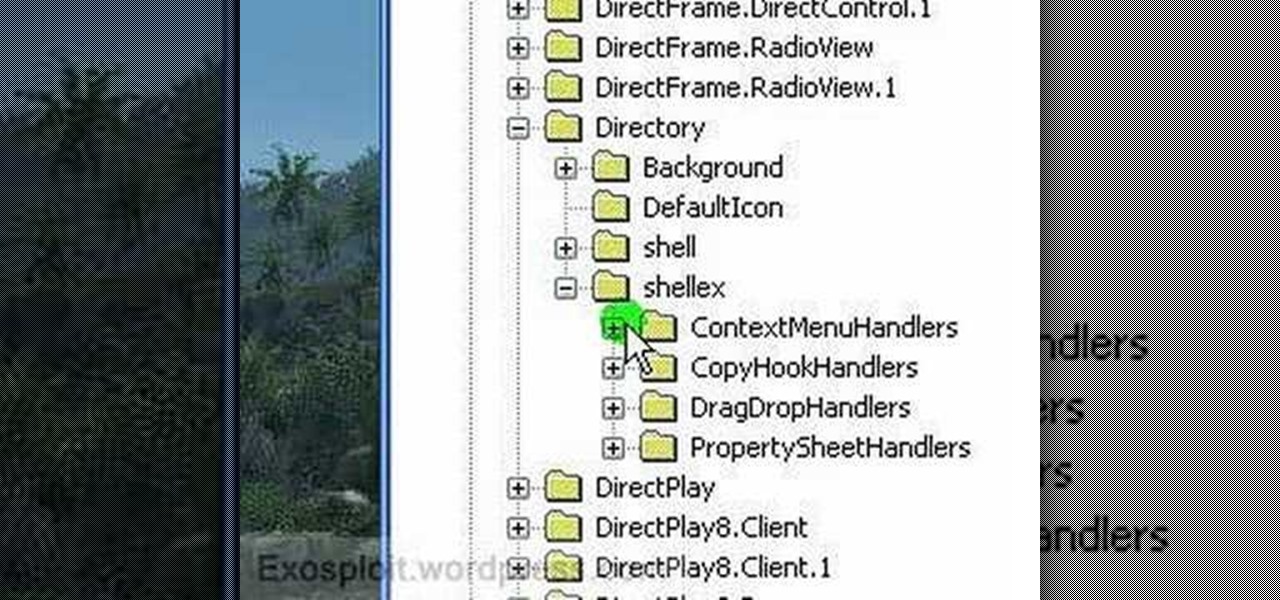
Context menus are menus that pop up when you right click an windows element (icons, windows, bars etc.). Sometimes, you would notice that many of the menu items are really not required.
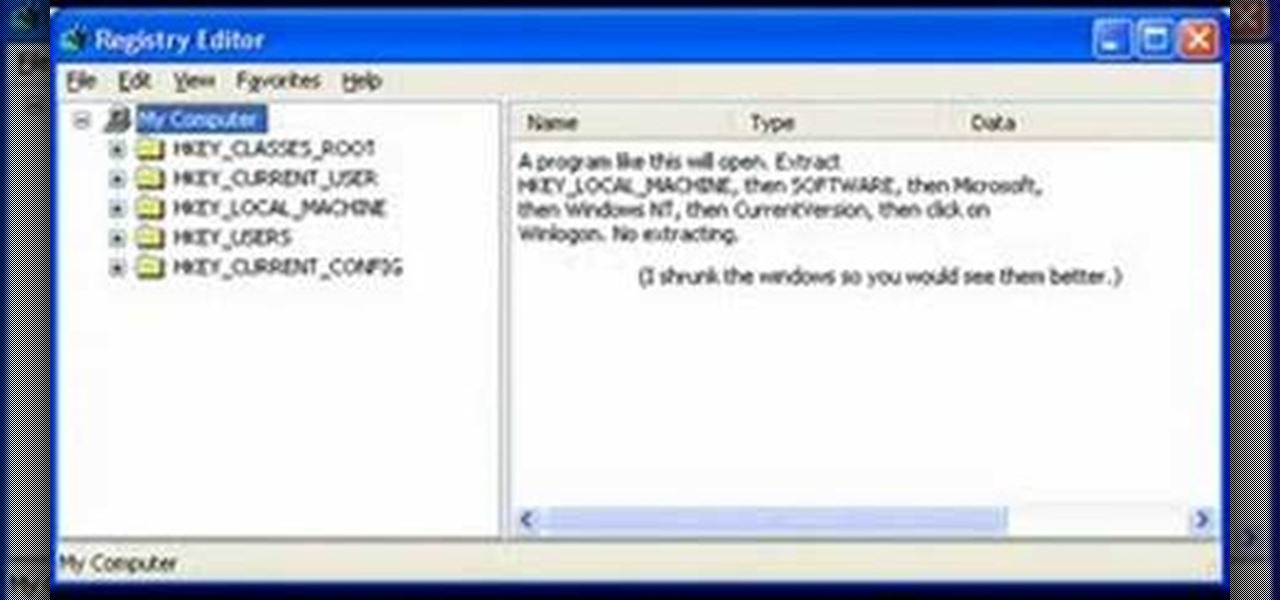
In this how-to video, you will learn how to change your start menu text. You will need resource hacker and regedit in order to perform this. First, open resource hacker. Click file and open. Go to 37, and click on 1033. Change 578 to whatever you want the text on the start menu to be. Press compile script. Next, save this file. Now, open regedit and go to software. Go to shell and click modify. Change the value data to the name of your .exe file, which should be saved in the windows folder. N...
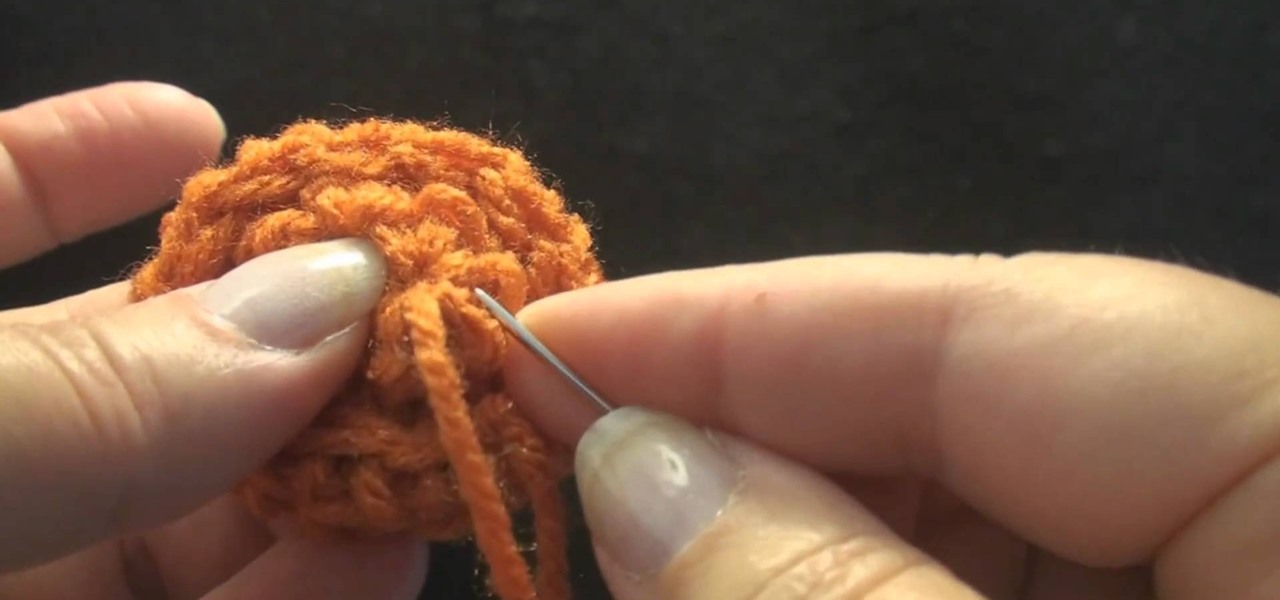
You don't have to buy buttons - just crochet your own! These buttons are naturally much softer than regular buttons, making them ideal for blankets or baby clothes. They also can add a cute accent to nearly any crochet project.

Make spinning 3D animations of spirographs, DNA, wormholes, spirals and tubes using Adobe Flash and Actionscript 3 in this video from the flashbuilding tutorial series designed for the regular guy and ordinary folks.

Don't let your window pane become a window pain in the ass to look at. Windows should give us clear views of the beautiful world outside, but without regular maintence they can become splotchy and muddled. Check out this video for a quick way to clearn your windows.

With constant Twitter updates, grueling commutes home, and a neverending workday, it's no wonder more and more of us have anxiety and stress on a regular basis. While you may not be able to just call it quits for a week and hit Fiji for some scuba fun, you can relive stress temporarily with a massage.
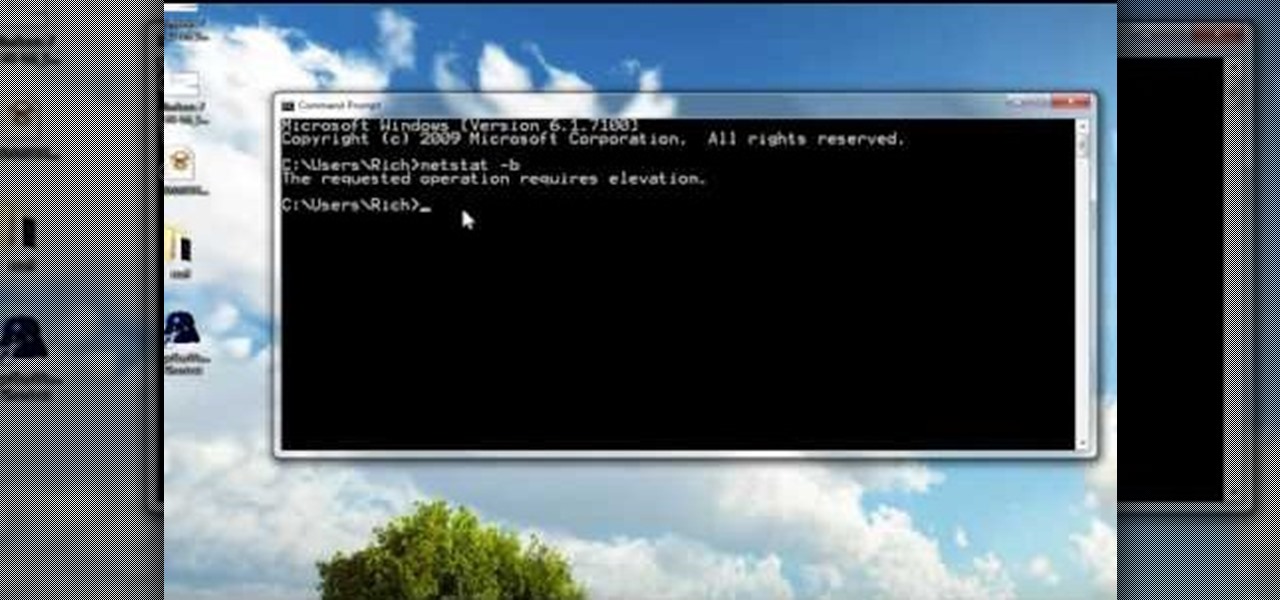
In this tutorial, we learn how to run a command prompt as administrator (Vista or 7). First, you will click on the start menu, then search for the term "prompt". Launch the command prompt, then a window will pop up with a black window. Type something in to see if it tells you the operation needs elevation. Now, click the start menu and type in "prompt" again. Then, click on the command link, right click, then click "run as administrator". Now, the new window will pop up that says "administrat...
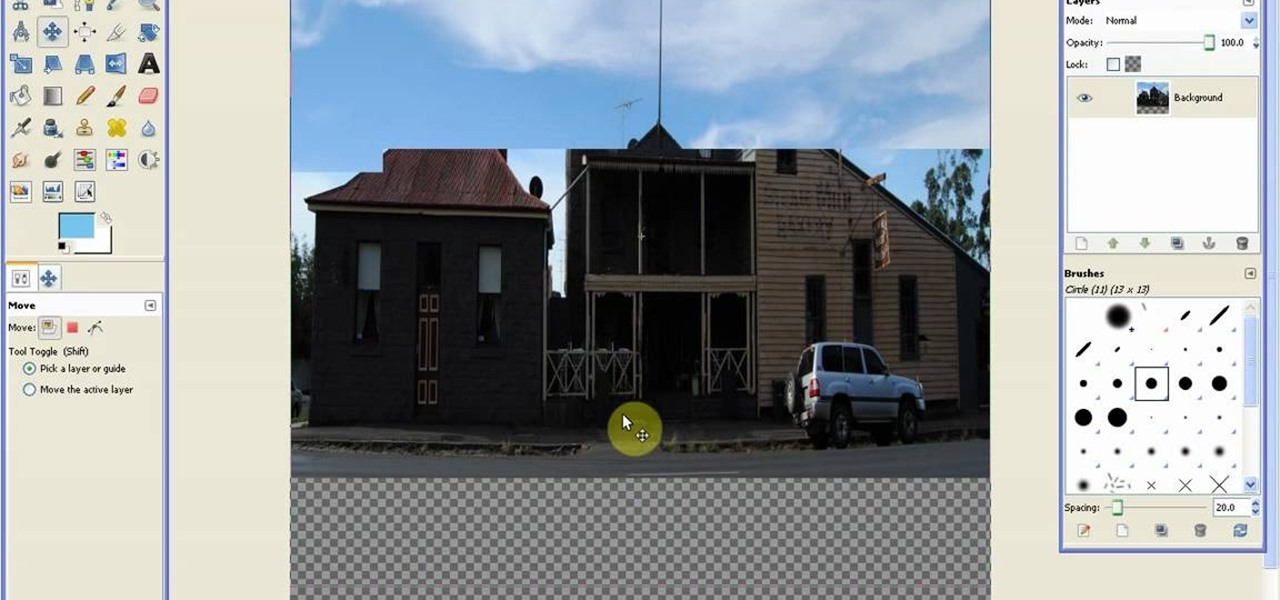
Polar panorama has images radiating out from the center of the picture. Starting with a regular panoramic image, this tutorial shows you how to use the free GIMP image editing software to create this 'polar panorama' effect for your next project.
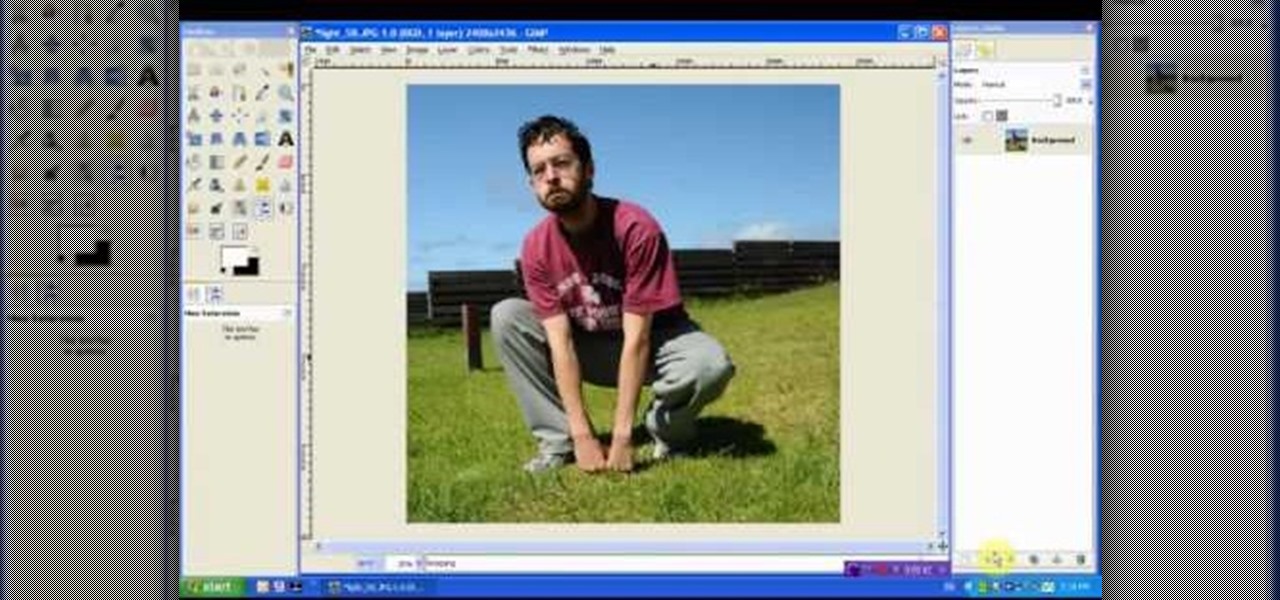
Turn a photograph of a regular person into an image of everyone's favorite muscular green psychopath! Using the hue slider, saturation tool and the Iwarp function, you can distort your picture in GIMP to make it look like a picture of Hulk instead.

Though rodents may have a bad reputation, a rat can make a great pet for kids. Rats need a good sized cage, lots of toys and regular trips to the vet to maintain their teeth and make sure they don't get sick. Follow these tips to keep your new pet happy and healthy!

Want to cut down on belly flab? Do you want a flatter, more attractive stomach? Use these workout tips to improve your abs! You can do a few of these exercises, like crunches or sit-ups, each day, and you'll be a regular fitness guru in no time!

This tutorial is for the Xbox Live Arcade and Playstation Network game Deathspank. It's a game that combines Monkey Island with Diablo.
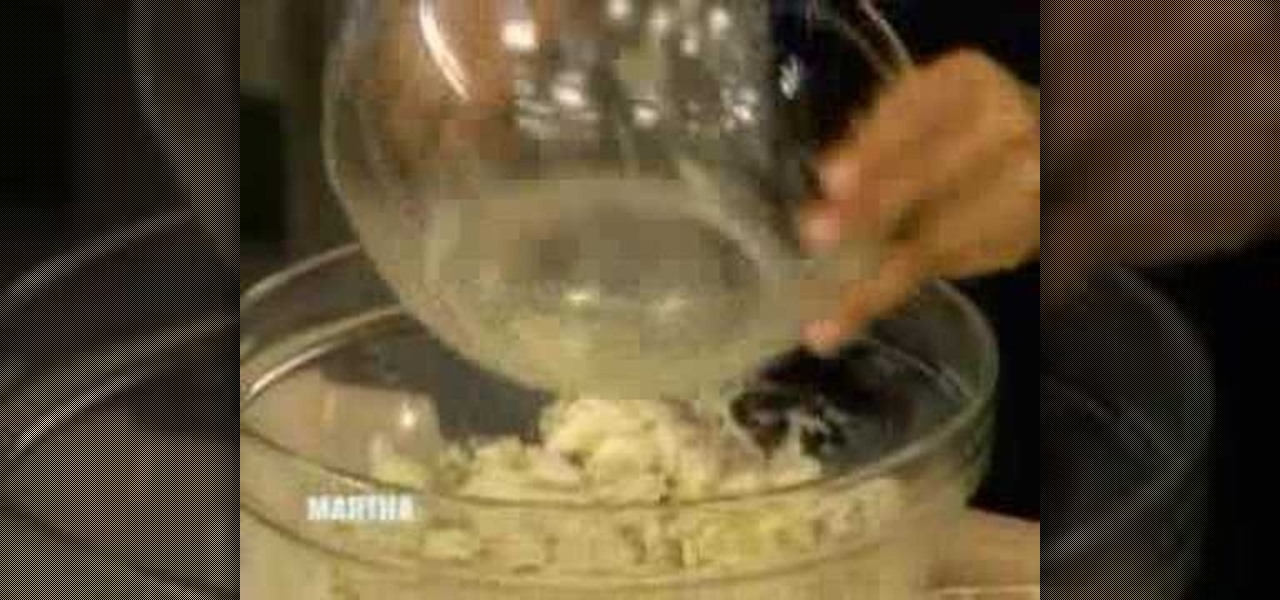
Making crabcakes for a summer get together on the beach is a yummy, season-appropriate way to integrate the goodies of the ocean into your cooking. Entertain with a delicious plate of Maryland crabcakes by watching this segment of "The Martha Stewart Show."
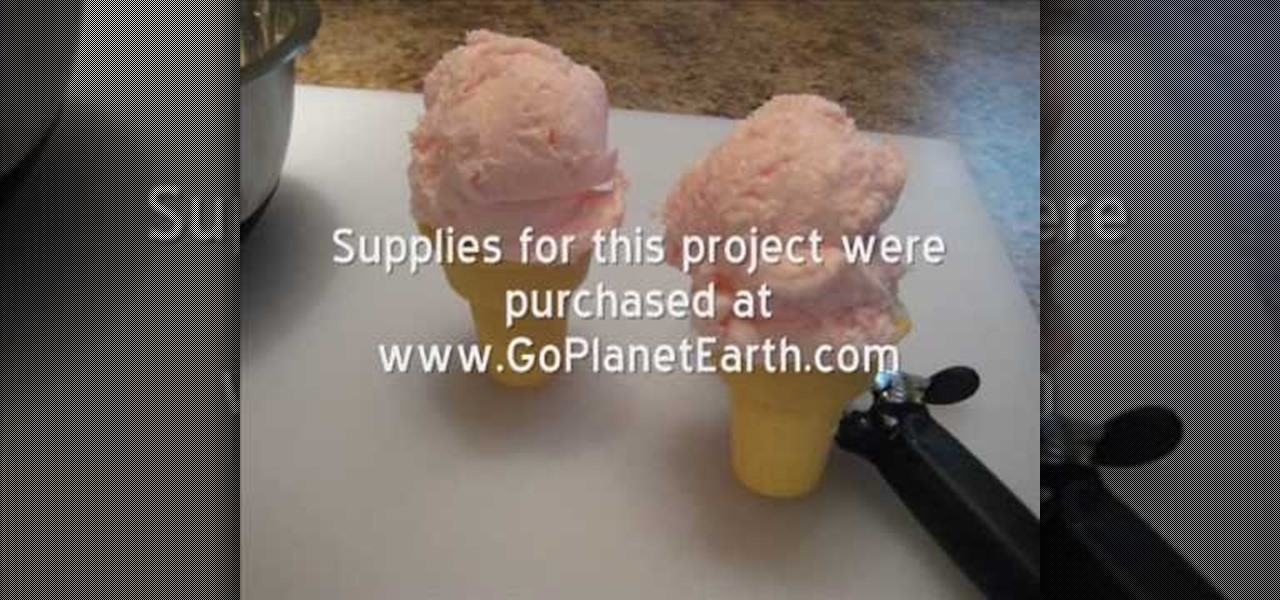
Need a summertime craft to do with your kids to keep their sundazed, lackadaisical minds occupied for a few moments? Then these ice cream cone soaps are just the thing!

If you're looking for an easy way to give your short hair waves and fullness, watch as this video demonstrates how to do so using a straightener and taking inspiration from the character Jenna Maroney (Jane Krakowski) of the show 30 Rock. Now all you need is Tina Fey and Alec Baldwin at your side and your a regular celebrity. Enjoy!

If you use Microsoft Excel on a regular basis, odds are you work with numbers. Put those numbers to work. Statistical analysis allows you to find patterns, trends and probabilities within your data. In this MS Excel tutorial from everyone's favorite Excel guru, YouTube's ExcelsFun, the 45th installment in his "Excel Statistics" series of free video lessons, you'll learn how to see how to calculate a z-score.

If you use Microsoft Excel on a regular basis, odds are you work with numbers. Put those numbers to work. Statistical analysis allows you to find patterns, trends and probabilities within your data. In this MS Excel tutorial from everyone's favorite Excel guru, YouTube's ExcelsFun, the 35.2nd installment in his "Excel Statistics" series of free video lessons, you'll learn how to use Excel's GEOMEAN function to find geometric mean.

If you use Microsoft Excel on a regular basis, odds are you work with numbers. Put those numbers to work. Statistical analysis allows you to find patterns, trends and probabilities within your data. In this MS Excel tutorial from everyone's favorite Excel guru, YouTube's ExcelsFun, the 40th installment in his "Excel Statistics" series of free video lessons, you'll learn how to calculate range & interquartile range for variability using the MAX, MIN, QUARTILE functions.

If you use Microsoft Excel on a regular basis, odds are you work with numbers. Put those numbers to work. Statistical analysis allows you to find patterns, trends and probabilities within your data. In this MS Excel tutorial from everyone's favorite Excel guru, YouTube's ExcelsFun, the 86th installment in his "Excel Statistics" series of free video lessons, you'll learn how to construct confidence intervals for proportions using NORMSINV function and other formulas.

If you use Microsoft Excel on a regular basis, odds are you work with numbers. Put those numbers to work. Statistical analysis allows you to find patterns, trends and probabilities within your data. In this MS Excel tutorial from everyone's favorite Excel guru, YouTube's ExcelsFun, the 87th installment in his "Excel Statistics" series of free video lessons, you'll learn how to calculate sample size (n) for confidence intervals.

If you use Microsoft Excel on a regular basis, odds are you work with numbers. Put those numbers to work. Statistical analysis allows you to find patterns, trends and probabilities within your data. In this MS Excel tutorial from everyone's favorite Excel guru, YouTube's ExcelsFun, the 27th installment in his "Excel Statistics" series of free video lessons, you'll learn how to create a quantitative data dot plot chart using the REPT and COUNTIF functions.

If you use Microsoft Excel on a regular basis, odds are you work with numbers. Put those numbers to work. Statistical analysis allows you to find patterns, trends and probabilities within your data. In this MS Excel tutorial from everyone's favorite Excel guru, YouTube's ExcelsFun, the 26th installment in his "Excel Statistics" series of free video lessons, you'll learn how to create quantitative data cumulative frequency distributions with pivot tables.

If you use Microsoft Excel on a regular basis, odds are you work with numbers. Put those numbers to work. Statistical analysis allows you to find patterns, trends and probabilities within your data. In this MS Excel tutorial from everyone's favorite Excel guru, YouTube's ExcelsFun, the 16th installment in his "Excel Statistics" series of free video lessons, you'll learn how to cross tabulate & do percentage cross tabulation for categorical data using a pivot table (PivotTable).

If you use Microsoft Excel on a regular basis, odds are you work with numbers. Put those numbers to work. Statistical analysis allows you to find patterns, trends and probabilities within your data. In this MS Excel tutorial from everyone's favorite Excel guru, YouTube's ExcelsFun, the 19th installment in his "Excel Statistics" series of free video lessons, you'll learn how to group categories in a frequency distribution with a formula (2 COUNTIF) and the pivot table (PivotTable) grouping fea...

If you use Microsoft Excel on a regular basis, odds are you work with numbers. Put those numbers to work. Statistical analysis allows you to find patterns, trends and probabilities within your data. In this MS Excel tutorial from everyone's favorite Excel guru, YouTube's ExcelsFun, the 17th installment in his "Excel Statistics" series of free video lessons, you'll learn how to cross tabulate & do percentage cross tabulation for categorical data using formulas rather than pivot tables.

If you use Microsoft Excel on a regular basis, odds are you work with numbers. Put those numbers to work. Statistical analysis allows you to find patterns, trends and probabilities within your data. In this MS Excel tutorial from everyone's favorite Excel guru, YouTube's ExcelsFun, the 3rd installment in his "Excel Statistics" series of free video lessons, you'll learn how to use Excel's sorting and pivot tables (PivotTables) data analysis tools.

If you use Microsoft Excel on a regular basis, odds are you work with numbers. Put those numbers to work. Statistical analysis allows you to find patterns, trends and probabilities within your data. In this MS Excel tutorial from everyone's favorite Excel guru, YouTube's ExcelsFun, the 35th installment in his "Excel Statistics" series of free video lessons, you'll learn how to calculate weighted and geometric means and see how to use the GEOMEAN function.
If you use Microsoft Excel on a regular basis, odds are you work with numbers. Put those numbers to work. Statistical analysis allows you to find patterns, trends and probabilities within your data. In this MS Excel tutorial from everyone's favorite Excel guru, YouTube's ExcelsFun, the 33rd installment in his "Excel Statistics" series of free video lessons, you'll learn how to use the AVEARGE, MEDIAN, MODE, PERCENTILE, QUARTILE and PERCENTILERANK functions to measure location.

If you use Microsoft Excel on a regular basis, odds are you work with numbers. Put those numbers to work. Statistical analysis allows you to find patterns, trends and probabilities within your data. In this MS Excel tutorial from everyone's favorite Excel guru, YouTube's ExcelsFun, the 4th installment in his "Excel Statistics" series of free video lessons, you'll learn how to create a frequency table and percentage frequency table using a Pivot Table (PivotTable).

We all know that September 19th is National Talking Like A Pirate Day, but did you know that even your Facebook page can join in the festivities? At the top of you Facebook page, click "Settings". From the page that comes up, click on the "Languages" tab. On the next page you will see a drop down menu of all of the languages that Facebook makes available to its users. Scroll down within this drop down menu until you see "English (Pirate)", and select this option. When the page reloads, your "...

Want to remove dried wax from a carpet? You'll need four items: a white towel, a regular electric iron, a carpet cleaning solution and a hot-water extraction machine. For a complete, step-by-step demonstration of how to remove pesky paraffin wax stains from your own carpet, watch this free housekeeping video tutorial.
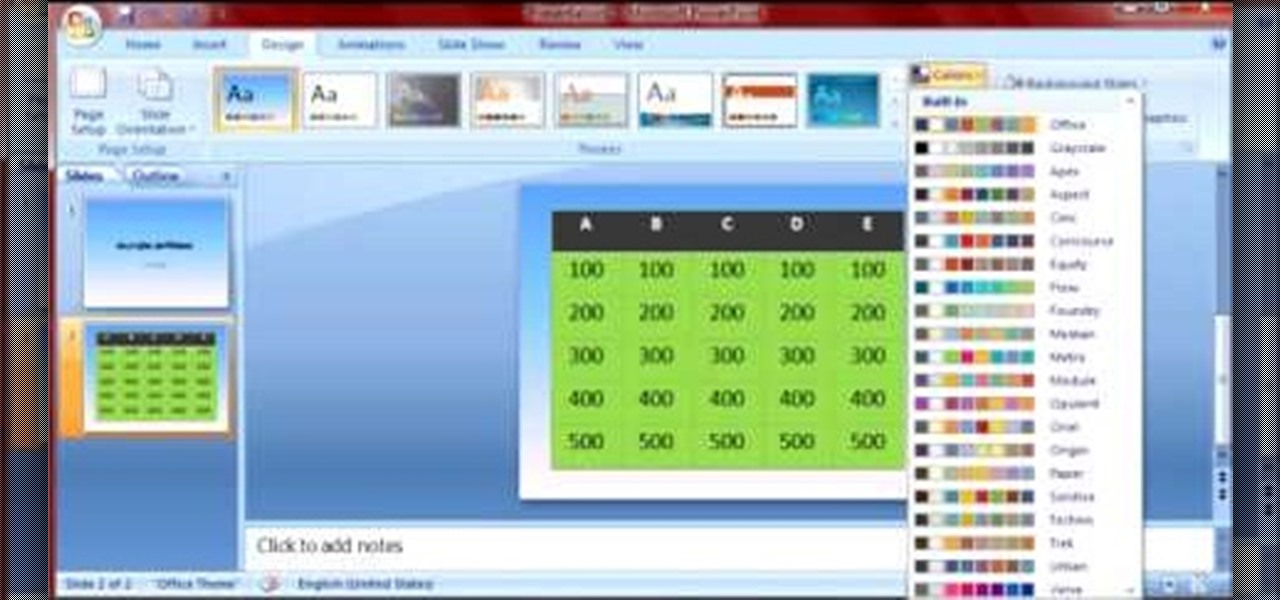
Microsoft PowerPoint is a powerful software to make presentations. It can also be used to make a Jeopardy board. To do this open a new PowerPoint presentation. Start with a title layout. Now add a gradient to its background. To do it right click on it and select the fill option from the menu. Select the color of you choice and fill the background. Now add the title in the layout with suitable fonts. Now add a new slide and insert a 5 X 6 table to it. Format the table with colors of your choic...
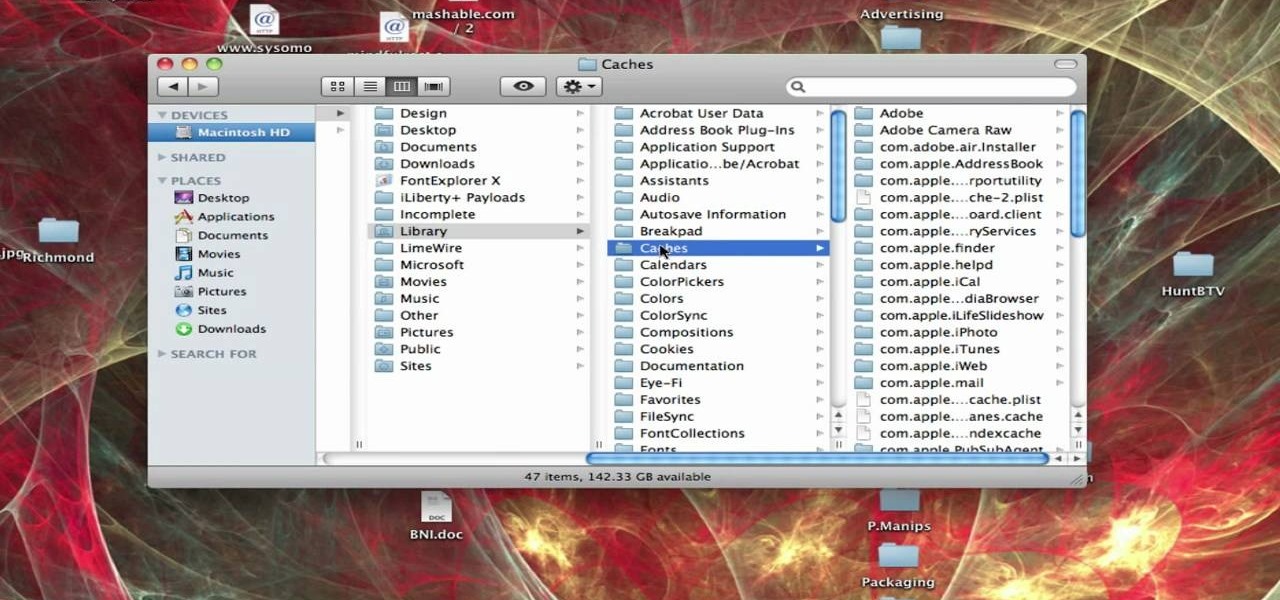
In this tutorial, Brian from TruTricks shows us how to delete a cache in a Mac or any Apple computer. This should be performed at least once every week. First, go down to the menu bar and click on "finder". Click on "Macintosh HD", "Library" ant then "Cache". Now, right click on "cache" and then select "delete" from the drop-down menu. Next, click on "users" and then click on your name, then click on "library", "Cache" and right click and select "Delete". Now, go to your trash can and empty y...