In this scientific video tutorial, undergraduate students in a forensic chemistry lab demonstrate how to perform gunshot residue analysis (GSR). Learn how to perform gun shot residue analysis (GSR)! Just like in CSI.

Dr. Keith Johnson shows how to correctly sample a large round bale for forage analysis Learn how to determine the nutritional content of the livestock feed to make sure that the dietetic needs of the farm animals being fed are being met.

Ready to clean out the clutter in your home and make a little money too? Learn how to organize a tag sale or garage sale and entice people to stop, look, and buy.

Matt covers some lines with a black ...Bg4. He found the first game with analysis on the Kenilworth Chess Club site. Most of the analysis he gave for this game is taken verbatim, but he does mention a couple side variations that you should be curious about. So watch!
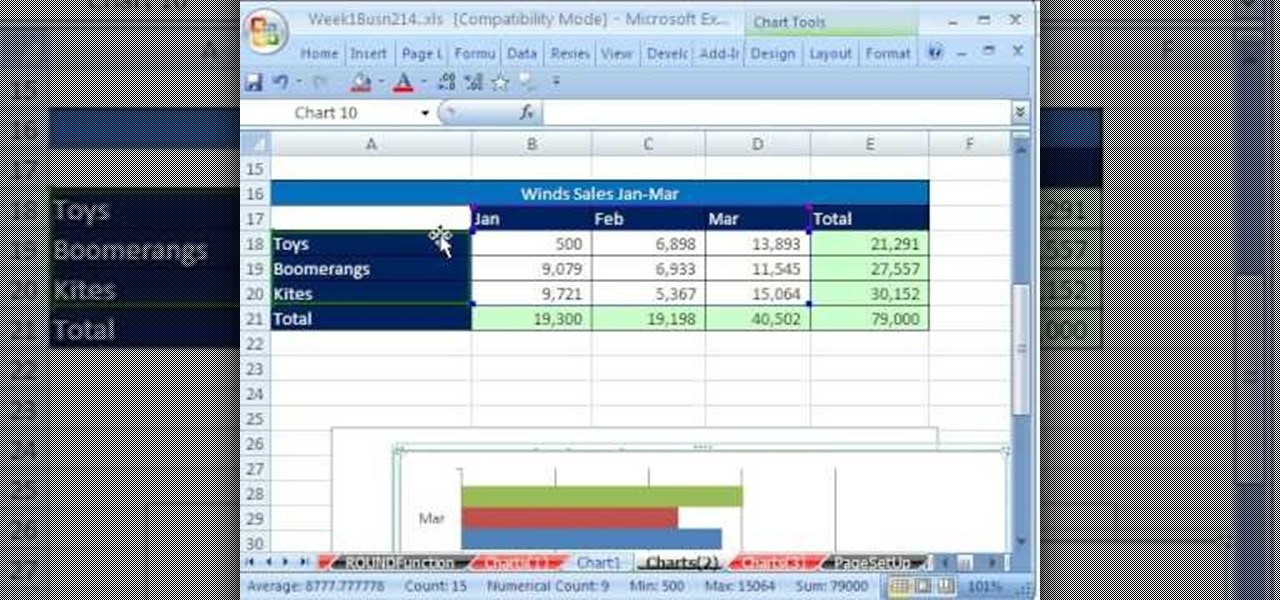
Whether you're interested in learning Microsoft Excel from the bottom up or just looking to pick up a few tips and tricks, you're in the right place. In this tutorial from everyone's favorite digital spreadsheet guru, ExcelIsFun, the 5th installment in his "Highline Excel Class" series of free video Excel lessons, you'll learn how to create seven types of charts — X-Y scatter diagrams, pie charts, column charts, bar charts, stacked bar charts, line charts, and column and line chart combined. ...

If you use Microsoft Excel on a regular basis, odds are you work with numbers. Put those numbers to work. Statistical analysis allows you to find patterns, trends and probabilities within your data. In this MS Excel tutorial from everyone's favorite Excel guru, YouTube's ExcelsFun, the very first installment in his "Excel Statistics" series of free video lessons, you'll learn how to get started doing statistical analysis in Microsoft Excel 2007.

This how-to video is about how to enable the commenting tools in the free Adobe Reader using Acrobat 9 Pro and Acrobat 9 Pro Extended.

You may think you know Microsoft's apps, but did you know that you could be using them as a power user and make yourself way more productive in the process? Thankfully, the easiest way to master them from home is on sale right now, as The Premium Microsoft Office & Data Apps Certification Bundle is on offer for just $39.99 — a huge 97% off the regular price of $1,782.

We all know how volatile the stock market is, especially during times of crisis. That does not mean that the market is impossible to gauge, however. Day traders are trained to read charts in order to recognize market trends and price patterns, giving them the insight they need to make their trades as profitable as possible.

Augmented reality sells, but who's buying? Over the past week, two companies made executive hires to capitalize on the growth of augmented reality as a service to sell to other businesses. Meanwhile, two companies joined forces to offer augmented reality tools to headset makers and content providers.

With the massive popularity of online clothing brands like Missguided and Fashion Nova, it seems that shopping in-store is a thing of the past. I admit that I love browsing from the comfort of my own bed, but there's something to be said for actually going to a store, speaking to people with similar tastes and penchants for shopping. Fortunately, with Frenzy — Shopify's new app for iOS — you get all of the convenience of online shopping, plus the opportunity to interact with other users in pe...

Unlock the "Closer Analysis: Hidden Intel" trophy in Call of Duty: Black Ops! This achievement is won by finding the hidden intelligence documents in Missions 11, 12 & 13.

Unlock the third "Closer Analysis: Hidden Intel" trophy in Call of Duty: Black Ops! This achievement is won by finding the hidden intelligence documents in Missions 14 & 15.

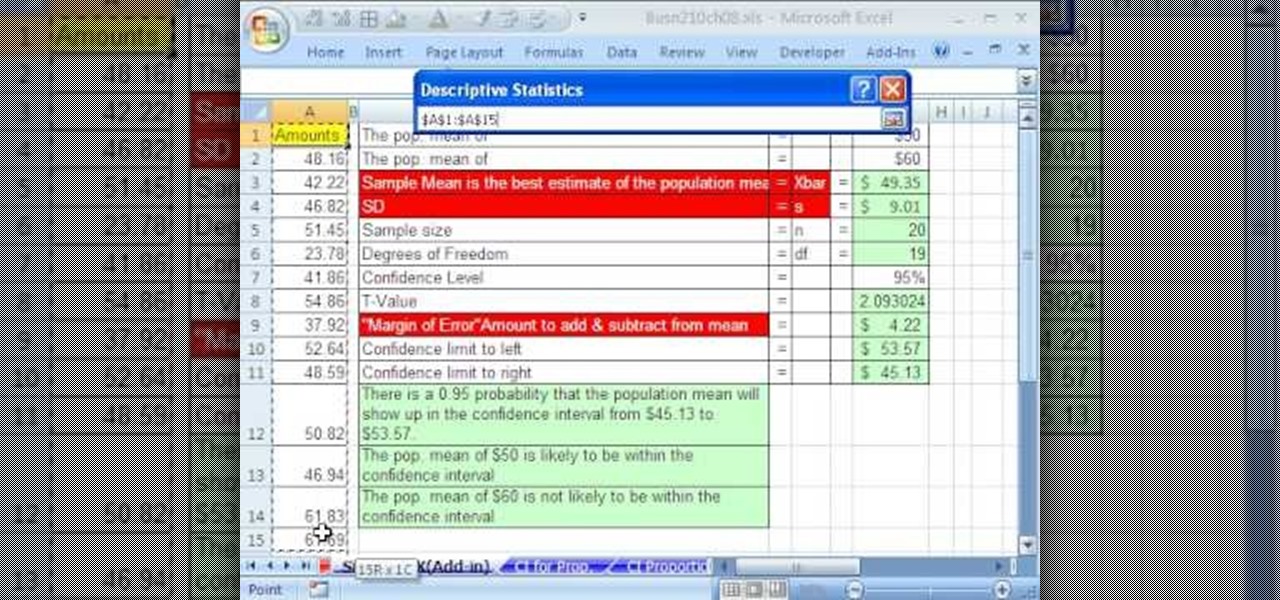
If you use Microsoft Excel on a regular basis, odds are you work with numbers. Put those numbers to work. Statistical analysis allows you to find patterns, trends and probabilities within your data. In this MS Excel tutorial from everyone's favorite Excel guru, YouTube's ExcelsFun, the 84th installment in his "Excel Statistics" series of free video lessons, you'll learn how to construct confidence intervals when the sigma is NOT known using the Descriptive Statistics data analysis add-in.

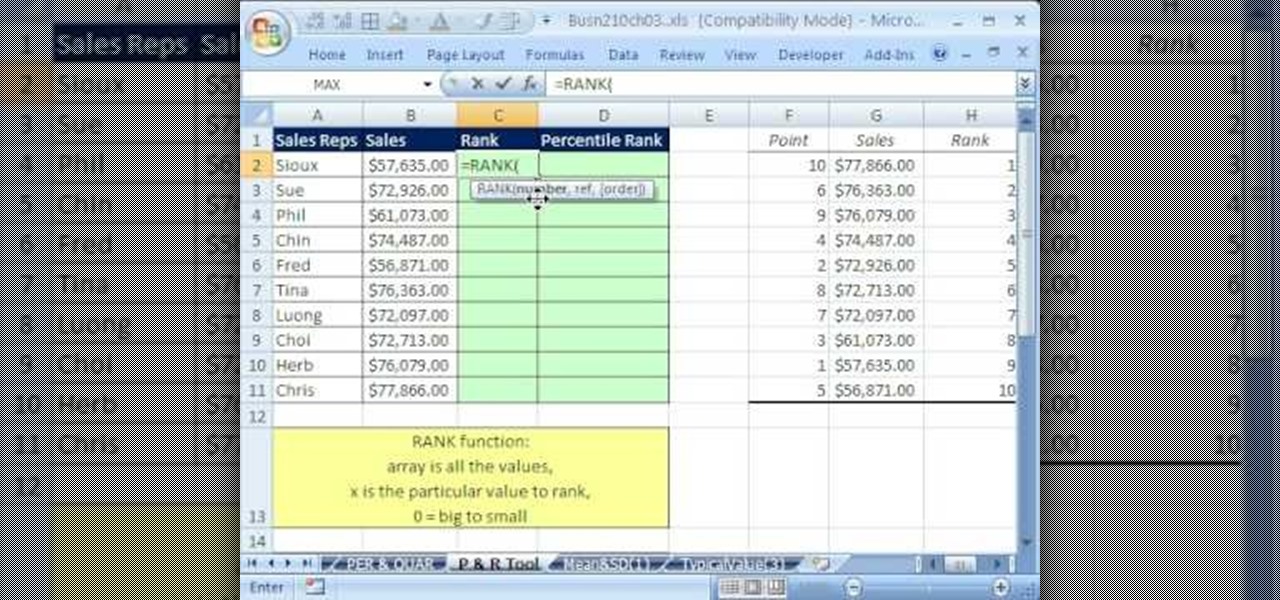
If you use Microsoft Excel on a regular basis, odds are you work with numbers. Put those numbers to work. Statistical analysis allows you to find patterns, trends and probabilities within your data. In this MS Excel tutorial from everyone's favorite Excel guru, YouTube's ExcelsFun, the 38th installment in his "Excel Statistics" series of free video lessons, you'll learn how to use the RANK and PERCENTRANK functions as well as the Data Analysis add-in's Rank & Percentile tools.

"I was wondering if you could take the triad Harmonic Analysis lesson you had done a step further and cover the concept of Transposing chord progressions into other keys?" Before you begin you do have to know some background information about your key signatures, knowing major, minor and diminished steps in triad analysis, and seventh chord harmony. The idea of transposing is that your take a set of notes and change they key it is originally played in. Andrew will walk you through all the ste...

This video is based on a chemistry experiment. This video is going to explain to us how to use gravimetric analysis in order to analyze sulfuric acid. This experiment should not be done for those who do not have a fundamental knowledge of chemical compounds, reactions and chemical safety. He explains first what he is about to do before he does it. Sulfuric acid is acidic and can be toxic if ingested or in contact with the eyes. Take extreme care with this experiment.

If you or someone you're shopping for has a newer iPhone model or an Android smartphone like the Galaxy Note 9 or Pixel 3, they come with wireless charging capabilities. Problem is, they don't come with wireless chargers. But there's no better time to snag one than on Black Friday, and we've found the best deals out there for 2018's holiday season.

Over the past week, companies took a variety of approaches to investing in augmented reality. Lampix is backing its own effort to build an ecosystem for augmented reality platforms. Nokia and Xiaomi are teaming up on numerous fronts, potentially including augmented reality.

Google has a new smartphone, and if you own a TV or a computer, you've almost certainly heard about it. The ad campaign for the Pixel and Pixel XL is approaching iPhone levels of omnipresence, as Google has reportedly spent over $3.2 million on marketing, with that number expected to skyrocket in the coming months.

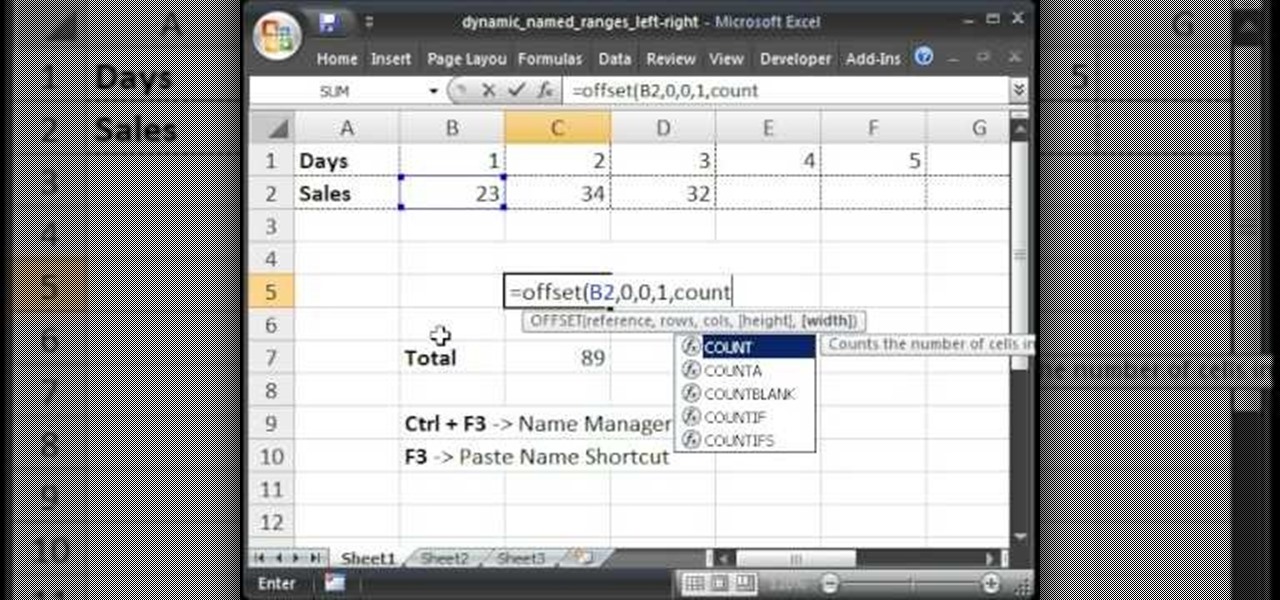
Teach Excel describes how to create a dynamically updating named range that goes from left to right using Excel. First, you define the named range by highlighting the cells containing numbers in a certain row. In the name box to the left of the formula bar, type the name of the data. In this example, the numbers correspond to sales, so type "sales." To check if the named range works, click on an empty cell and enter =sum(sales). That should return the sum of the highlighted cells. However, as...

In this video Andrea Osterkorn demonstrates how to stage your home for sale. It is not a comfortable process to transform your home into a home for sale. The entry way should be inviting because first impressions are important. Closets should be cleaned out. Consider renting different furniture for the living area to make it more open and inviting, and move it around to create an impression of space. Add accessories and let natural light in. Try to depersonalize the room and remove clutter so...

This chess tutorial from Grandmaster Alexandra Kosteniuk is a perfect example of Retrograde Analysis.

If you have created a product that you want to sell, getting a UPC code for it will allow you to track purchases and give your business a more professional air. This video will explain how you go about getting a UPC code and using it to help your business.

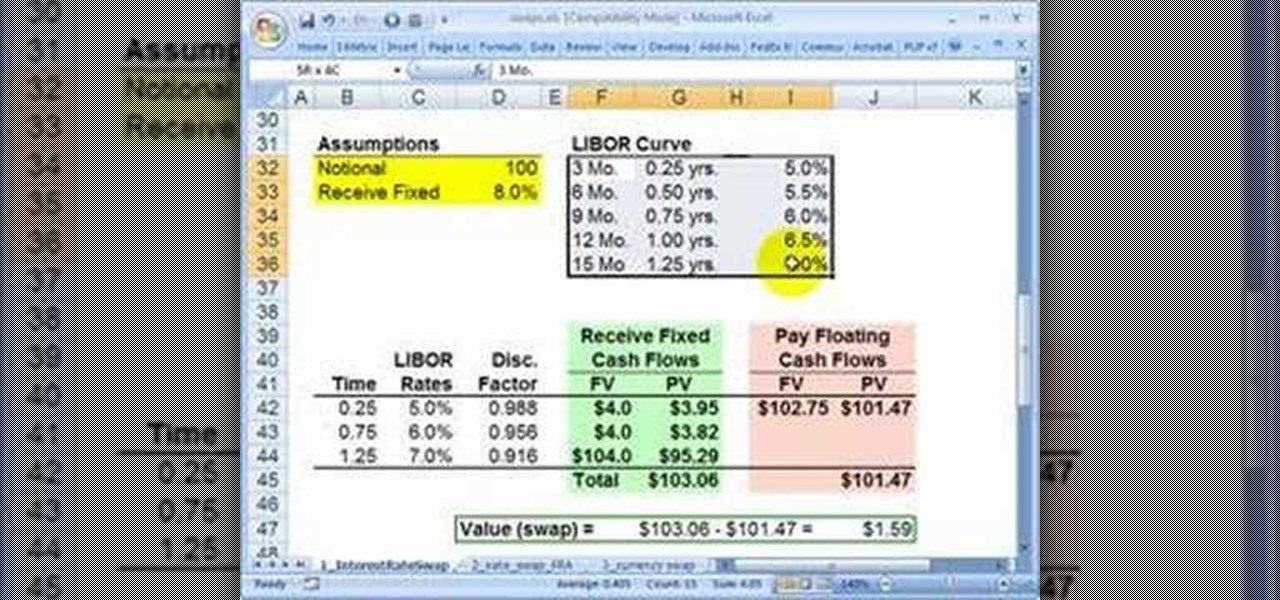
High finance and statistical analysis are too complex for most people once they forget what they learned in high school. If you are an investor or small business owner, you can't afford to forget this stuff. This video will teach you how to value an interest rate swap, good info for financial professionals and students.

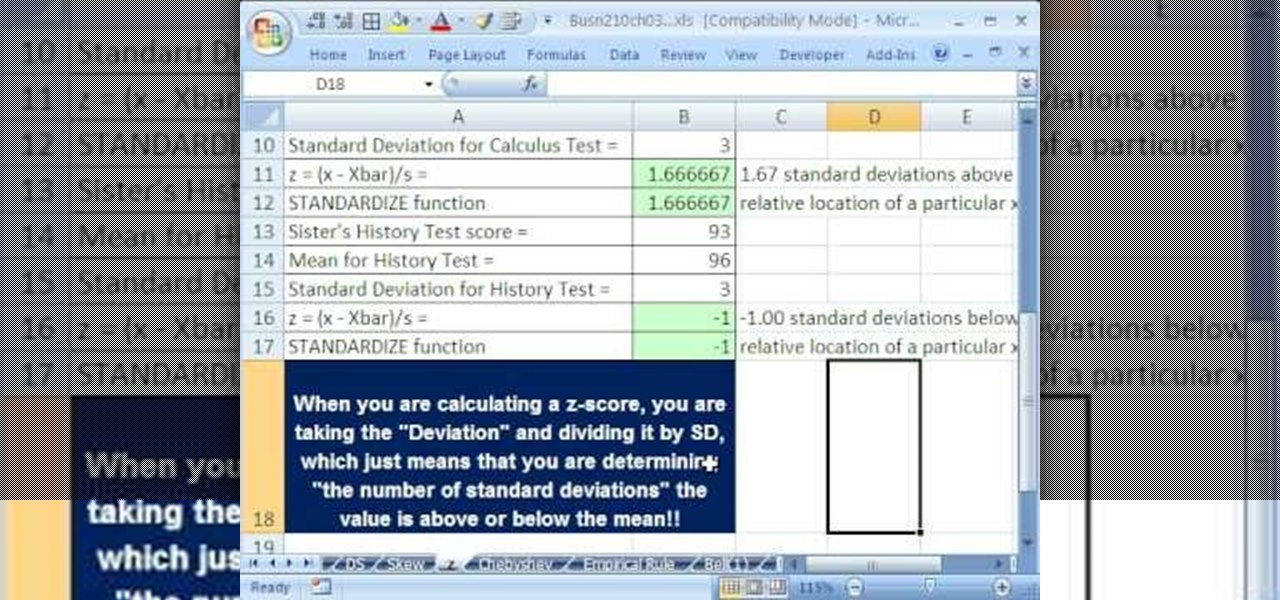
If you use Microsoft Excel on a regular basis, odds are you work with numbers. Put those numbers to work. Statistical analysis allows you to find patterns, trends and probabilities within your data. In this MS Excel tutorial from everyone's favorite Excel guru, YouTube's ExcelsFun, the 45th installment in his "Excel Statistics" series of free video lessons, you'll learn how to see how to calculate a z-score.

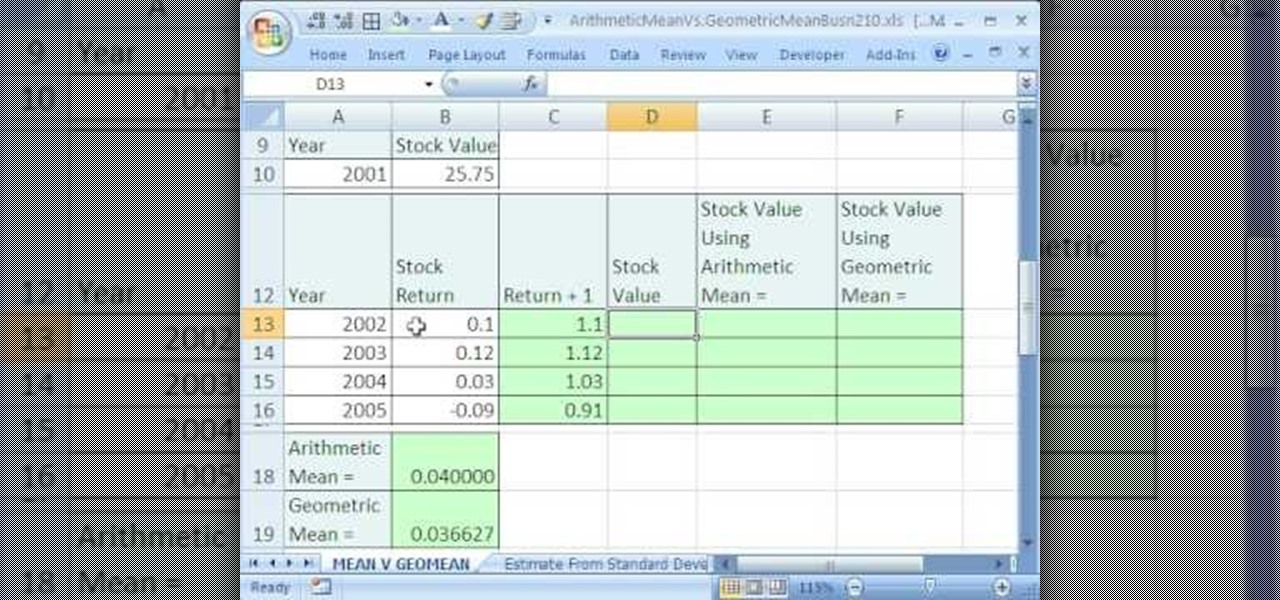
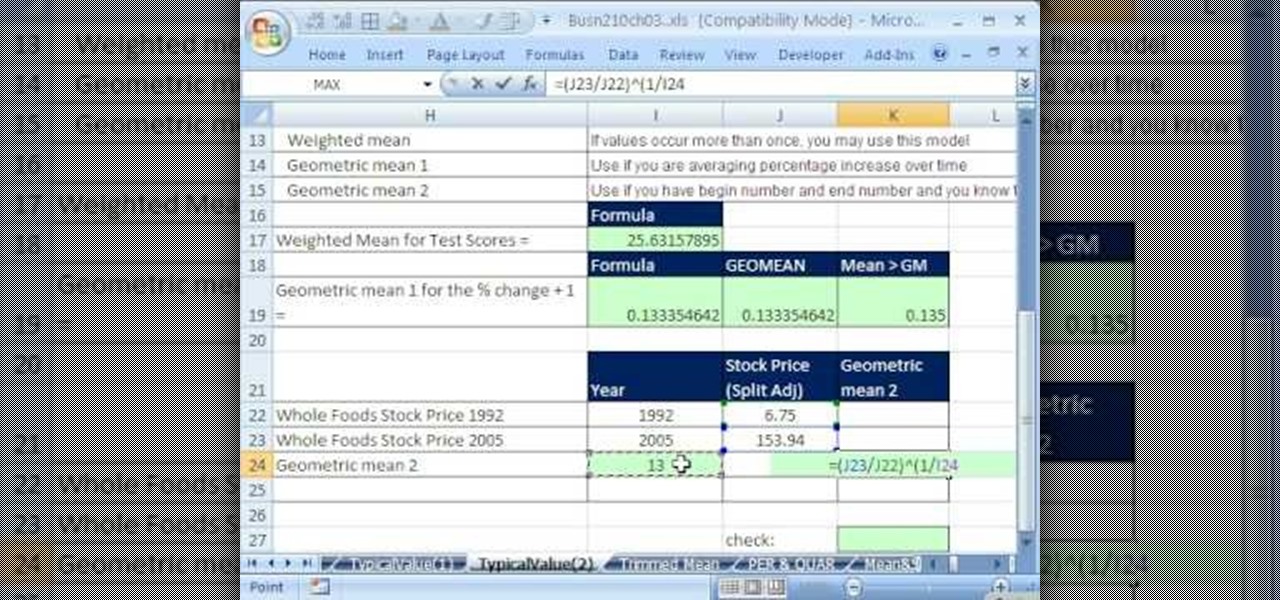
If you use Microsoft Excel on a regular basis, odds are you work with numbers. Put those numbers to work. Statistical analysis allows you to find patterns, trends and probabilities within your data. In this MS Excel tutorial from everyone's favorite Excel guru, YouTube's ExcelsFun, the 35.2nd installment in his "Excel Statistics" series of free video lessons, you'll learn how to use Excel's GEOMEAN function to find geometric mean.

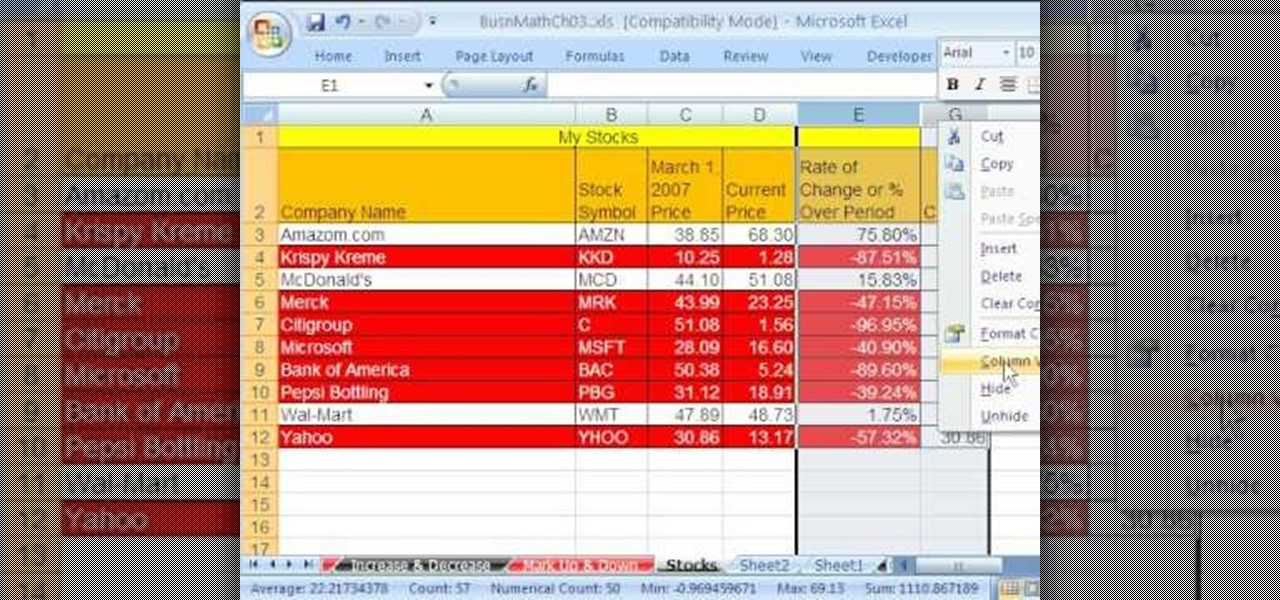
As you might guess, one of the domains in which Microsoft Excel really excels is business math. Brush up on the stuff for your next or current job with this how-to. In this tutorial from everyone's favorite digital spreadsheet guru, YouTube's ExcelIsFun, the 33rd installment in his "Excel Business Math" series of free video lessons, you'll learn how to add current stock prices to a stock analysis table in Excel using a web query.

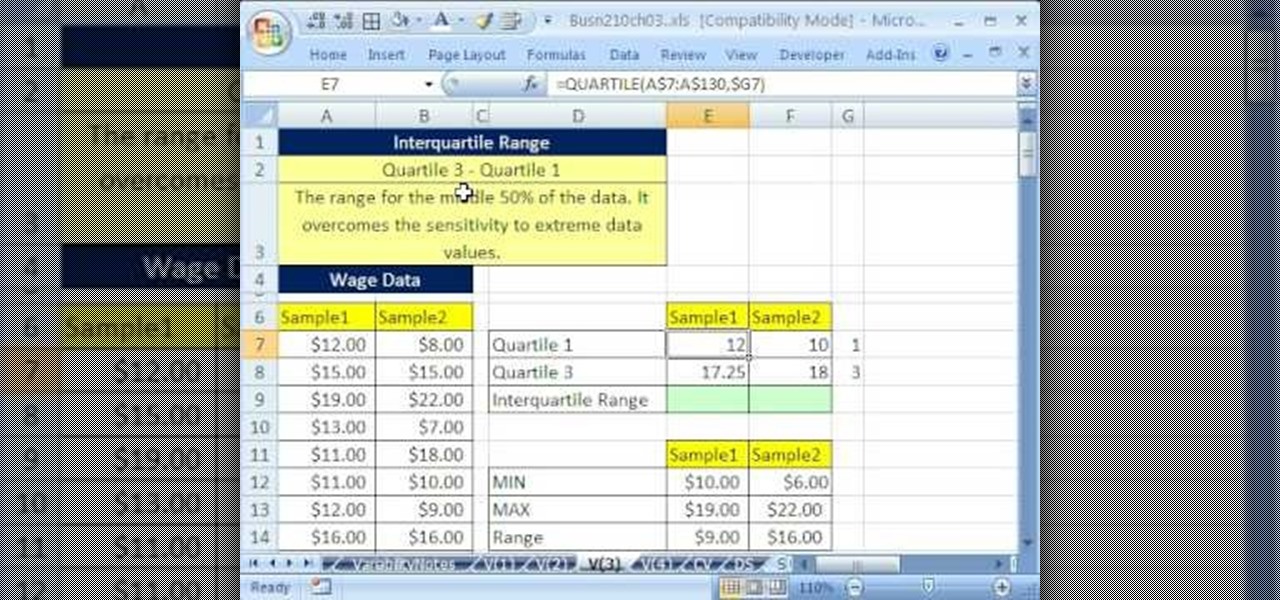
If you use Microsoft Excel on a regular basis, odds are you work with numbers. Put those numbers to work. Statistical analysis allows you to find patterns, trends and probabilities within your data. In this MS Excel tutorial from everyone's favorite Excel guru, YouTube's ExcelsFun, the 40th installment in his "Excel Statistics" series of free video lessons, you'll learn how to calculate range & interquartile range for variability using the MAX, MIN, QUARTILE functions.

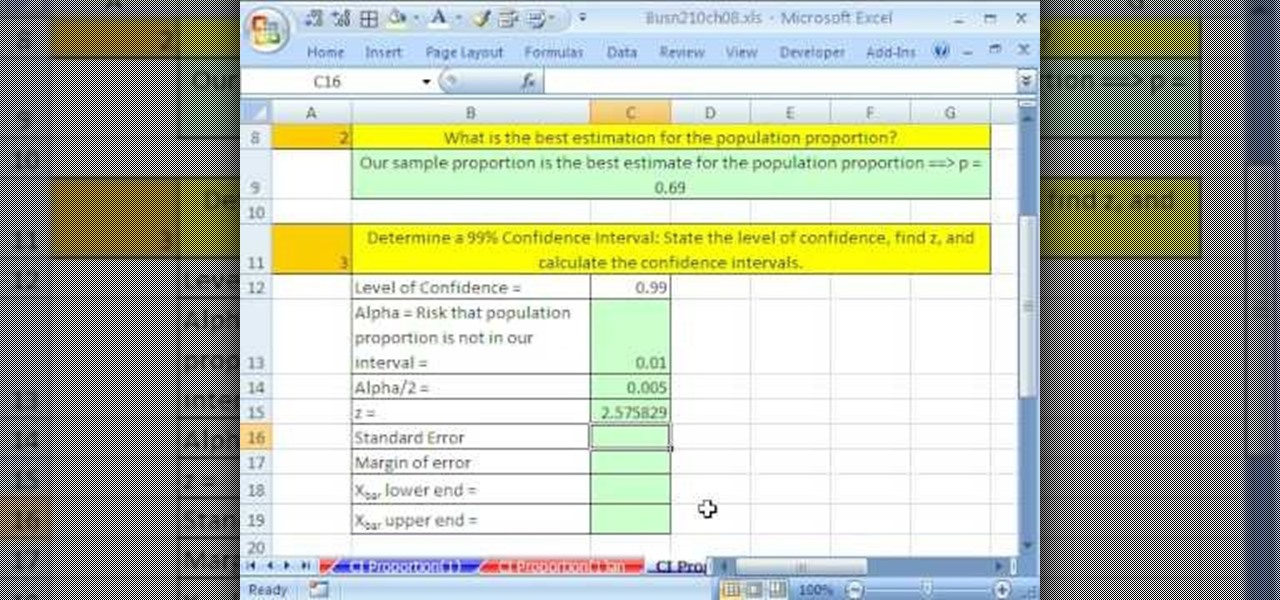
If you use Microsoft Excel on a regular basis, odds are you work with numbers. Put those numbers to work. Statistical analysis allows you to find patterns, trends and probabilities within your data. In this MS Excel tutorial from everyone's favorite Excel guru, YouTube's ExcelsFun, the 86th installment in his "Excel Statistics" series of free video lessons, you'll learn how to construct confidence intervals for proportions using NORMSINV function and other formulas.

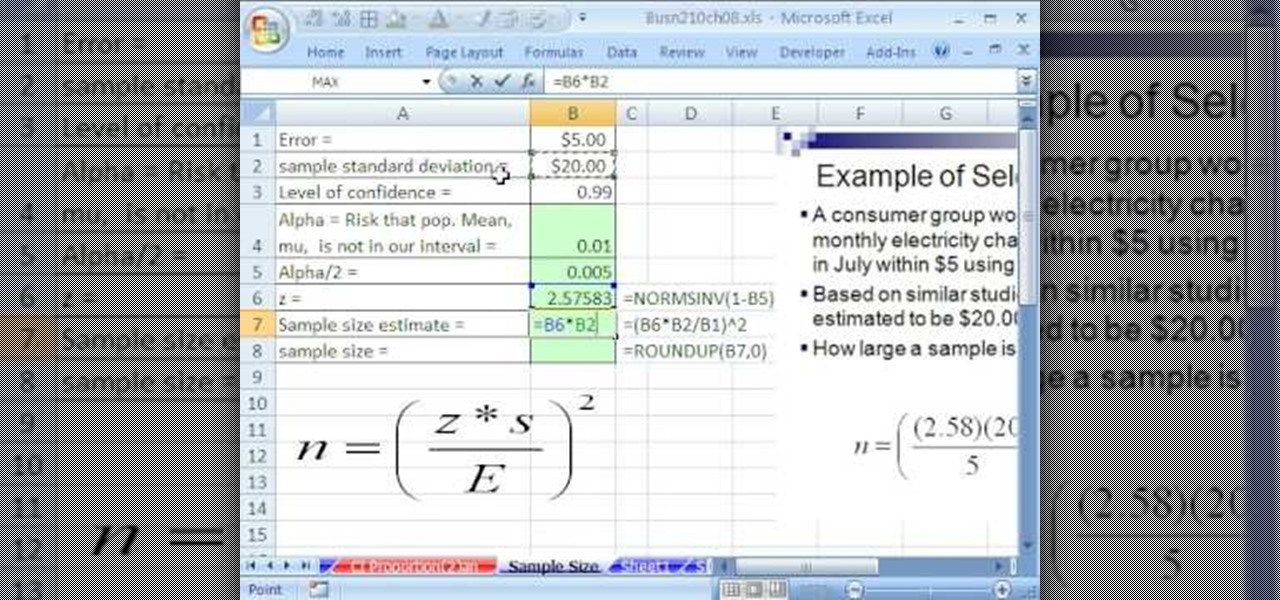
If you use Microsoft Excel on a regular basis, odds are you work with numbers. Put those numbers to work. Statistical analysis allows you to find patterns, trends and probabilities within your data. In this MS Excel tutorial from everyone's favorite Excel guru, YouTube's ExcelsFun, the 87th installment in his "Excel Statistics" series of free video lessons, you'll learn how to calculate sample size (n) for confidence intervals.

If you use Microsoft Excel on a regular basis, odds are you work with numbers. Put those numbers to work. Statistical analysis allows you to find patterns, trends and probabilities within your data. In this MS Excel tutorial from everyone's favorite Excel guru, YouTube's ExcelsFun, the 27th installment in his "Excel Statistics" series of free video lessons, you'll learn how to create a quantitative data dot plot chart using the REPT and COUNTIF functions.

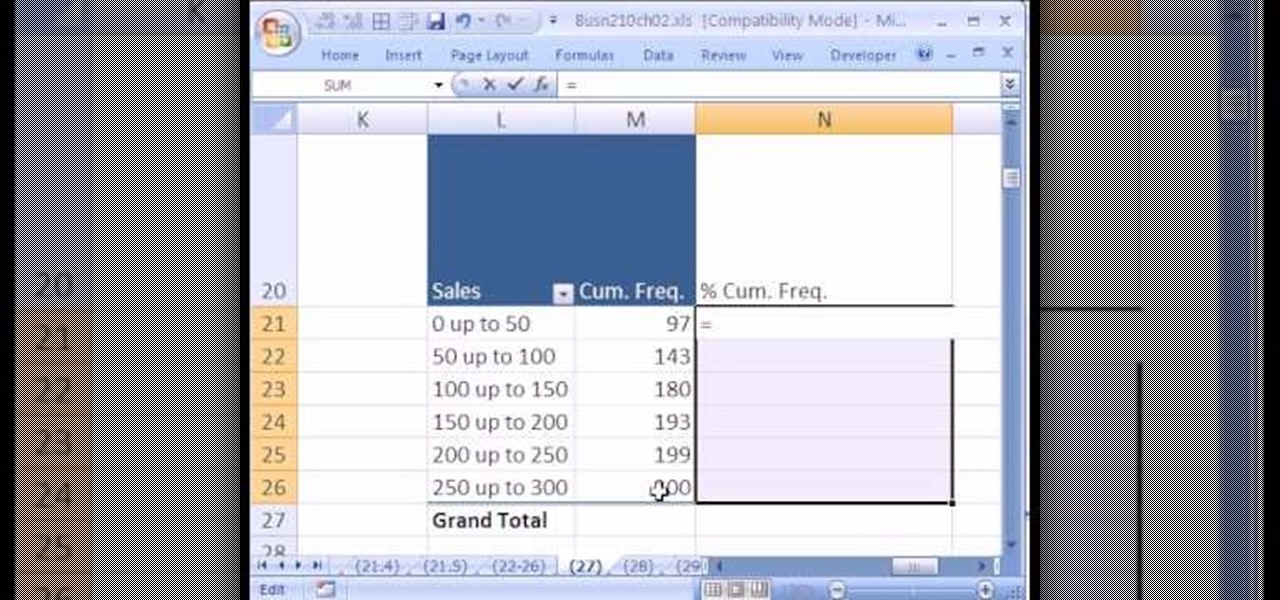
If you use Microsoft Excel on a regular basis, odds are you work with numbers. Put those numbers to work. Statistical analysis allows you to find patterns, trends and probabilities within your data. In this MS Excel tutorial from everyone's favorite Excel guru, YouTube's ExcelsFun, the 26th installment in his "Excel Statistics" series of free video lessons, you'll learn how to create quantitative data cumulative frequency distributions with pivot tables.

If you use Microsoft Excel on a regular basis, odds are you work with numbers. Put those numbers to work. Statistical analysis allows you to find patterns, trends and probabilities within your data. In this MS Excel tutorial from everyone's favorite Excel guru, YouTube's ExcelsFun, the 16th installment in his "Excel Statistics" series of free video lessons, you'll learn how to cross tabulate & do percentage cross tabulation for categorical data using a pivot table (PivotTable).

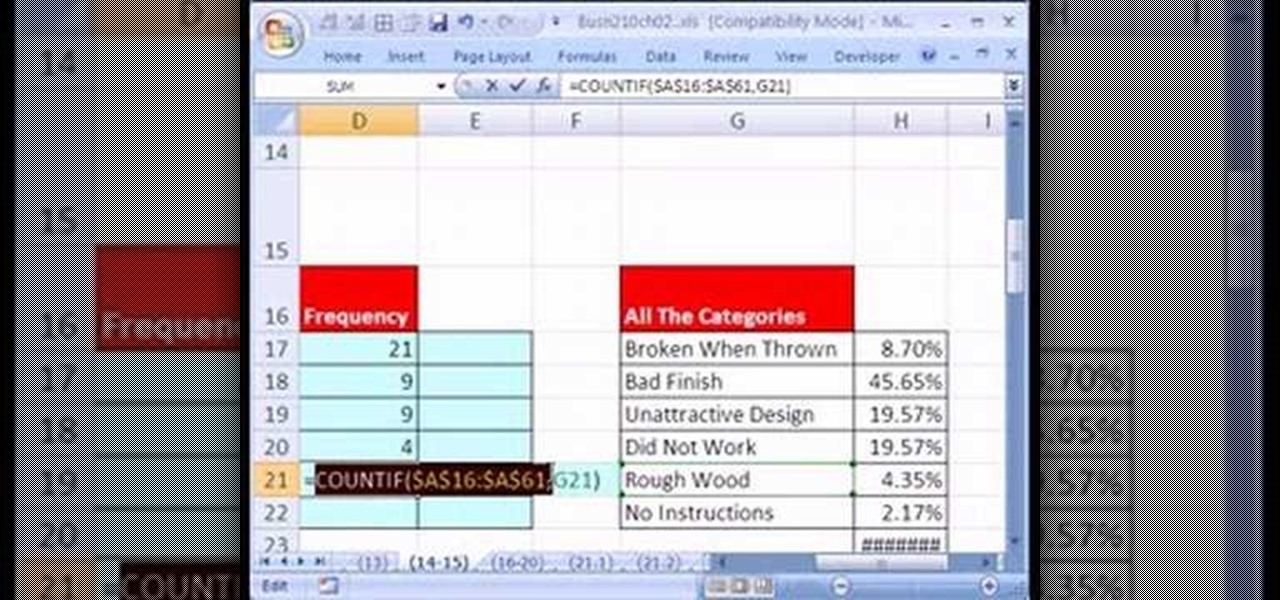
If you use Microsoft Excel on a regular basis, odds are you work with numbers. Put those numbers to work. Statistical analysis allows you to find patterns, trends and probabilities within your data. In this MS Excel tutorial from everyone's favorite Excel guru, YouTube's ExcelsFun, the 19th installment in his "Excel Statistics" series of free video lessons, you'll learn how to group categories in a frequency distribution with a formula (2 COUNTIF) and the pivot table (PivotTable) grouping fea...

If you use Microsoft Excel on a regular basis, odds are you work with numbers. Put those numbers to work. Statistical analysis allows you to find patterns, trends and probabilities within your data. In this MS Excel tutorial from everyone's favorite Excel guru, YouTube's ExcelsFun, the 17th installment in his "Excel Statistics" series of free video lessons, you'll learn how to cross tabulate & do percentage cross tabulation for categorical data using formulas rather than pivot tables.

If you use Microsoft Excel on a regular basis, odds are you work with numbers. Put those numbers to work. Statistical analysis allows you to find patterns, trends and probabilities within your data. In this MS Excel tutorial from everyone's favorite Excel guru, YouTube's ExcelsFun, the 35th installment in his "Excel Statistics" series of free video lessons, you'll learn how to calculate weighted and geometric means and see how to use the GEOMEAN function.

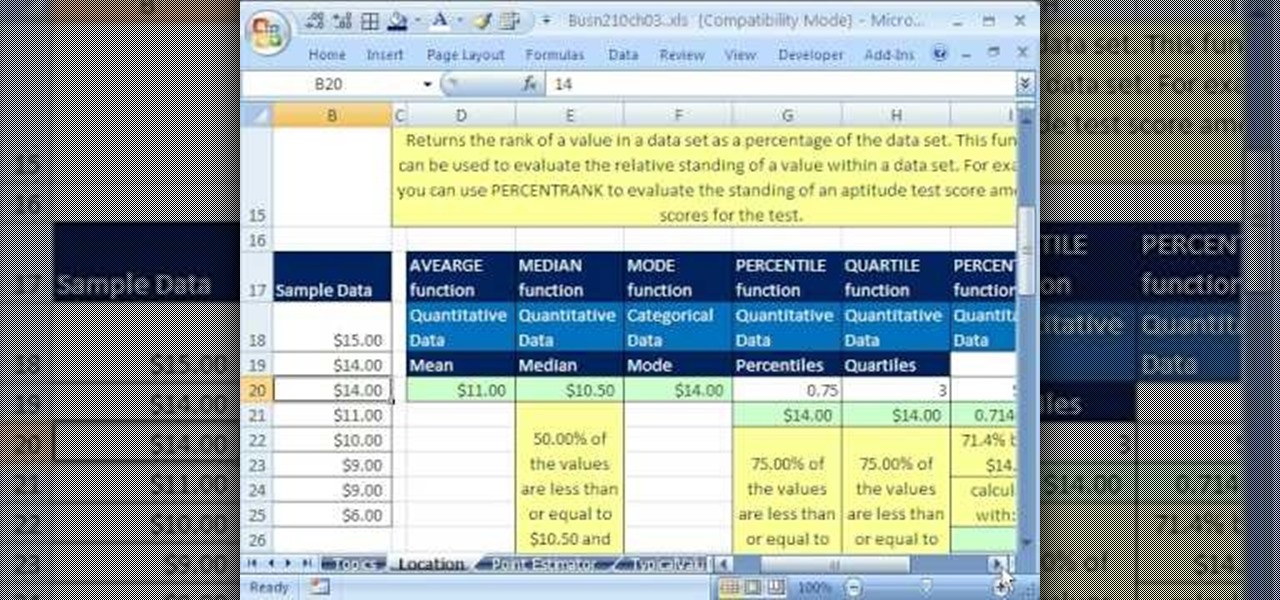
If you use Microsoft Excel on a regular basis, odds are you work with numbers. Put those numbers to work. Statistical analysis allows you to find patterns, trends and probabilities within your data. In this MS Excel tutorial from everyone's favorite Excel guru, YouTube's ExcelsFun, the 33rd installment in his "Excel Statistics" series of free video lessons, you'll learn how to use the AVEARGE, MEDIAN, MODE, PERCENTILE, QUARTILE and PERCENTILERANK functions to measure location.

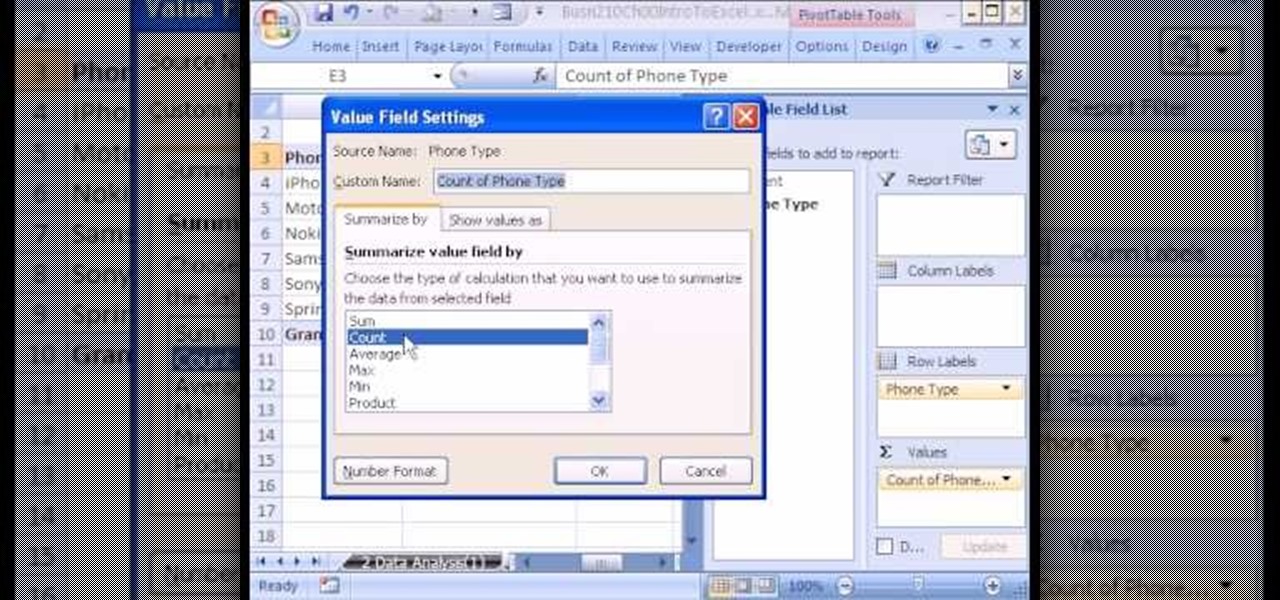
If you use Microsoft Excel on a regular basis, odds are you work with numbers. Put those numbers to work. Statistical analysis allows you to find patterns, trends and probabilities within your data. In this MS Excel tutorial from everyone's favorite Excel guru, YouTube's ExcelsFun, the 4th installment in his "Excel Statistics" series of free video lessons, you'll learn how to create a frequency table and percentage frequency table using a Pivot Table (PivotTable).

Welcome to a tennis lesson from FuzzyYellowBalls, the the best place to learn how to play tennis online. Our free video tennis lessons teach you how to play the game in a new way that combines technical analysis, visual learning, and step-by-step progressions.


