Welcome to a tennis lesson from FuzzyYellowBalls, the the best place to learn how to play tennis online. Our free video tennis lessons teach you how to play the game in a new way that combines technical analysis, visual learning, and step-by-step progressions.

This tutorial goes over how to perform ni-cho zai. This kata utilizes 2 zai (sais), and the video includes the bunkai, or step-by-step analysis.

Whether you work in sales or want to become more persuasive and better at selling yourself, the art of selling can be transferred to nearly any career path or walk of life. Whether the gains are monetary or interpersonal, being a great salesperson is one of the most invaluable skills you can ever learn.

On Tuesday, Apple held a public conference call for its Q2 earnings report. During the call, Steve Milunovich from UBS asked Tim Cook about a recent 451 report, and how it reflects a pause in current iPhone sales. Cook's response was more than interesting, to say the least:

This year's Nexus devices are already two of the best bang-for-your-buck smartphones on the market, but with a new sale price from several retailers across the net, they might just be an unbeatable deal.
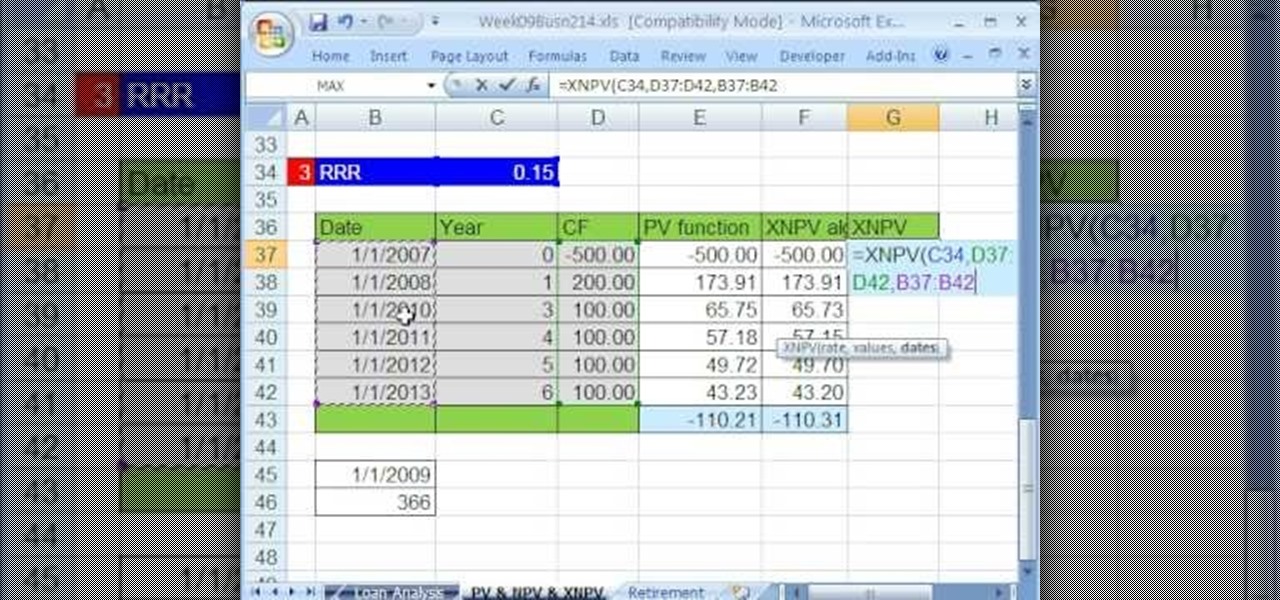
Whether you're interested in learning Microsoft Excel from the bottom up or just looking to pick up a few tips and tricks, you're in the right place. In this tutorial from everyone's favorite digital spreadsheet guru, ExcelIsFun, the 50th installment in his "Highline Excel Class" series of free video Excel lessons, you'll learn how to value an asset as well as perform discounted cash flow analysis with the Excel functions PV, NPV & XNPV.

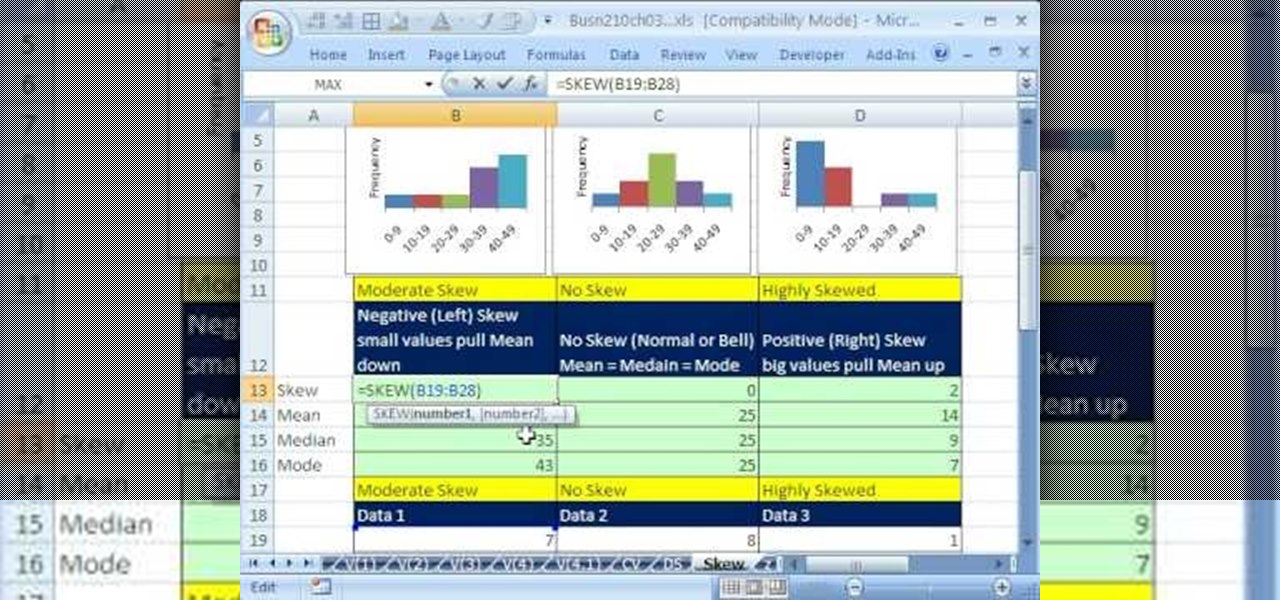
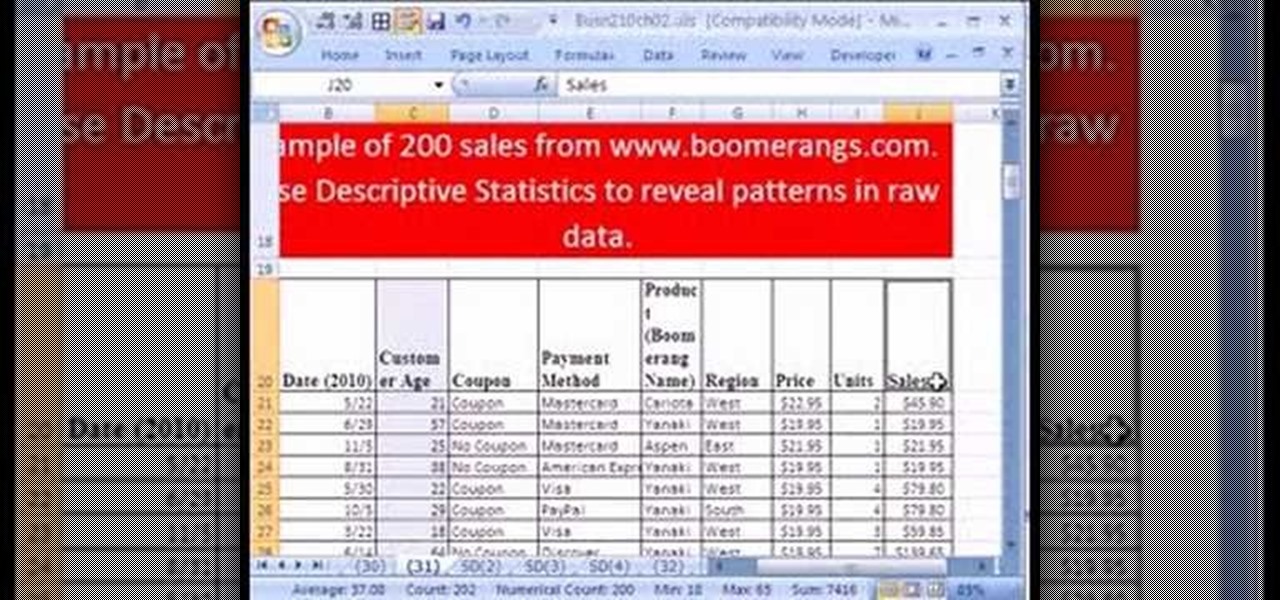
If you use Microsoft Excel on a regular basis, odds are you work with numbers. Put those numbers to work. Statistical analysis allows you to find patterns, trends and probabilities within your data. In this MS Excel tutorial from everyone's favorite Excel guru, YouTube's ExcelsFun, the 44th installment in his "Excel Statistics" series of free video lessons, you'll learn how to use the SKEW function to calculate the skew in a distribution of data.

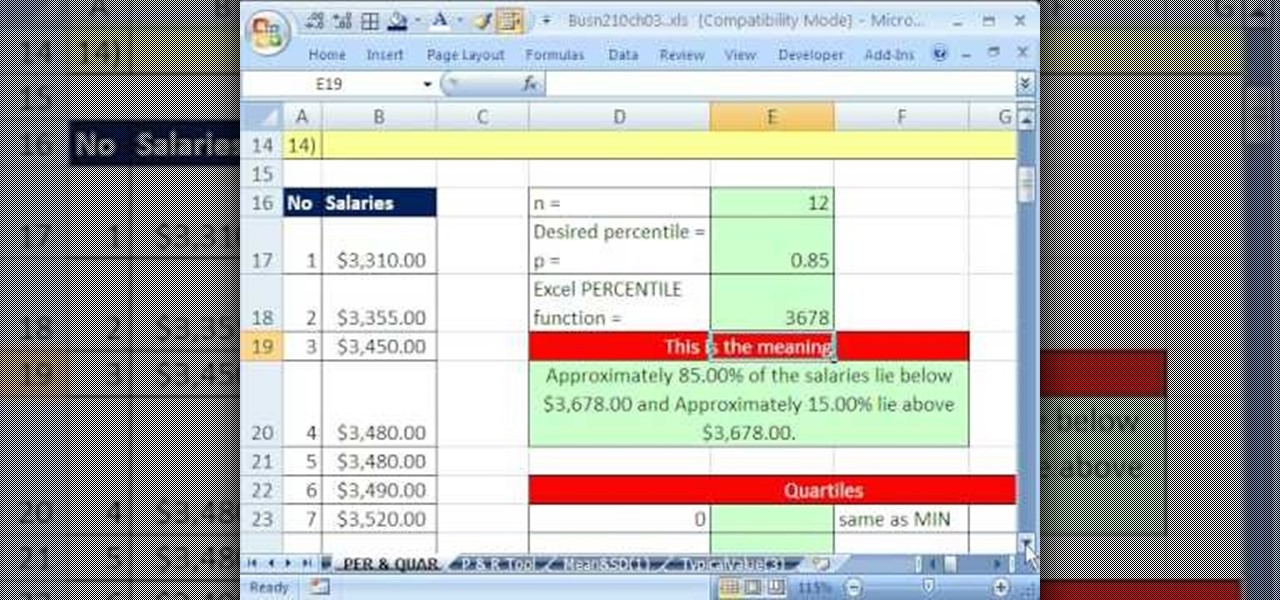
f you use Microsoft Excel on a regular basis, odds are you work with numbers. Put those numbers to work. Statistical analysis allows you to find patterns, trends and probabilities within your data. In this MS Excel tutorial from everyone's favorite Excel guru, YouTube's ExcelsFun, the 37th installment in his "Excel Statistics" series of free video lessons, you'll learn how to use the PERCENTILE and QUARTILE functions.

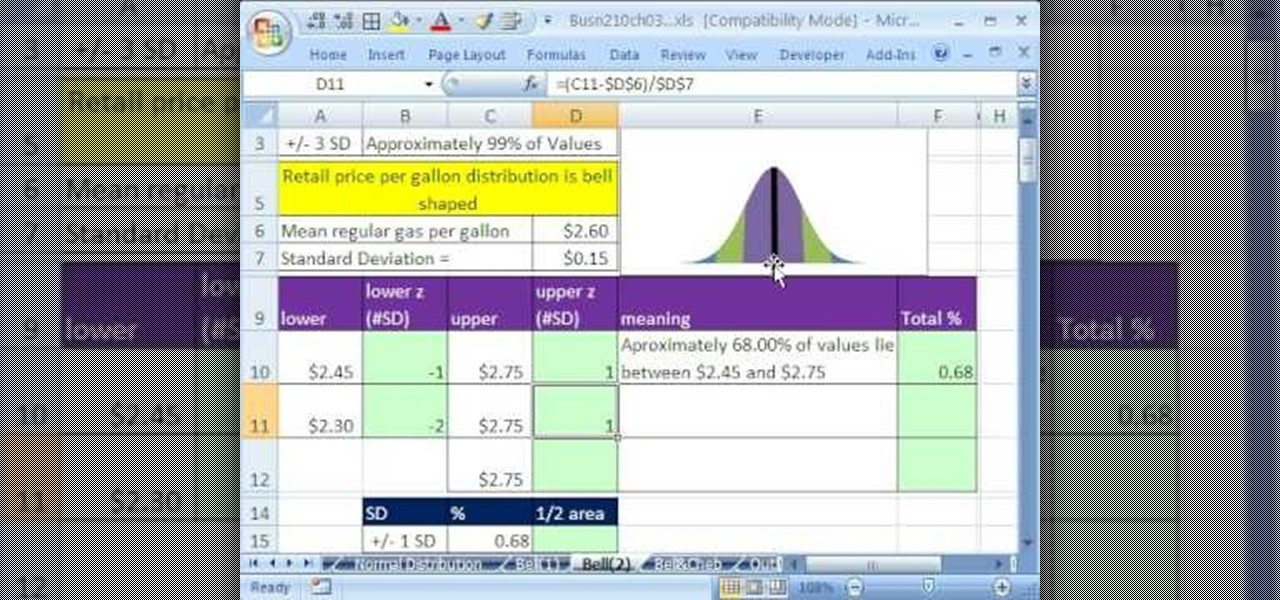
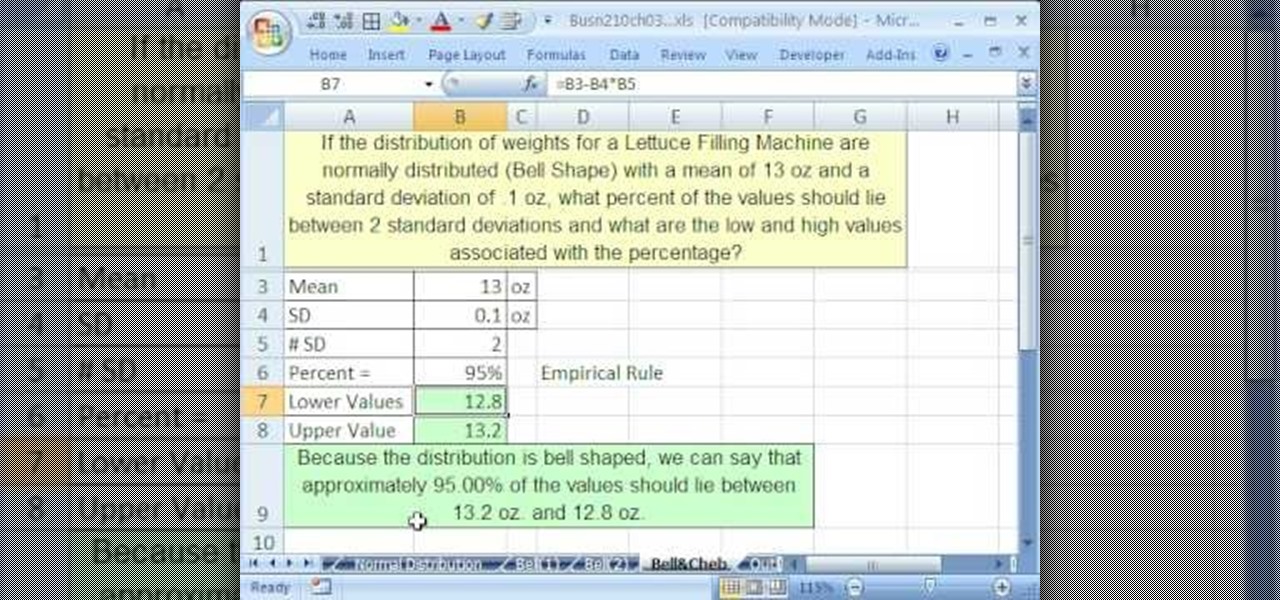
If you use Microsoft Excel on a regular basis, odds are you work with numbers. Put those numbers to work. Statistical analysis allows you to find patterns, trends and probabilities within your data. In this MS Excel tutorial from everyone's favorite Excel guru, YouTube's ExcelsFun, the 47th installment in his "Excel Statistics" series of free video lessons, you'll learn about the basics of the empirical rule (the bell curve) and how to apply it in various ways.

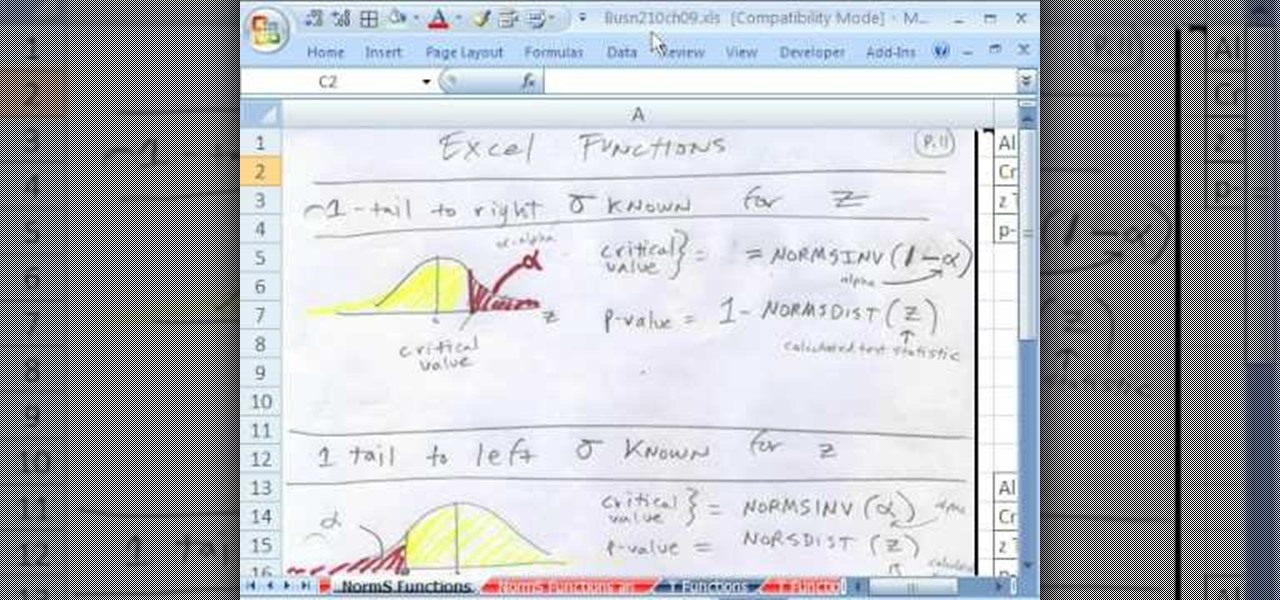
If you use Microsoft Excel on a regular basis, odds are you work with numbers. Put those numbers to work. Statistical analysis allows you to find patterns, trends and probabilities within your data. In this MS Excel tutorial from everyone's favorite Excel guru, YouTube's ExcelsFun, the 89th installment in his "Excel Statistics" series of free video lessons, you'll learn how to use the NORMSINV function for critical values and the NORSDIST function for p-values.

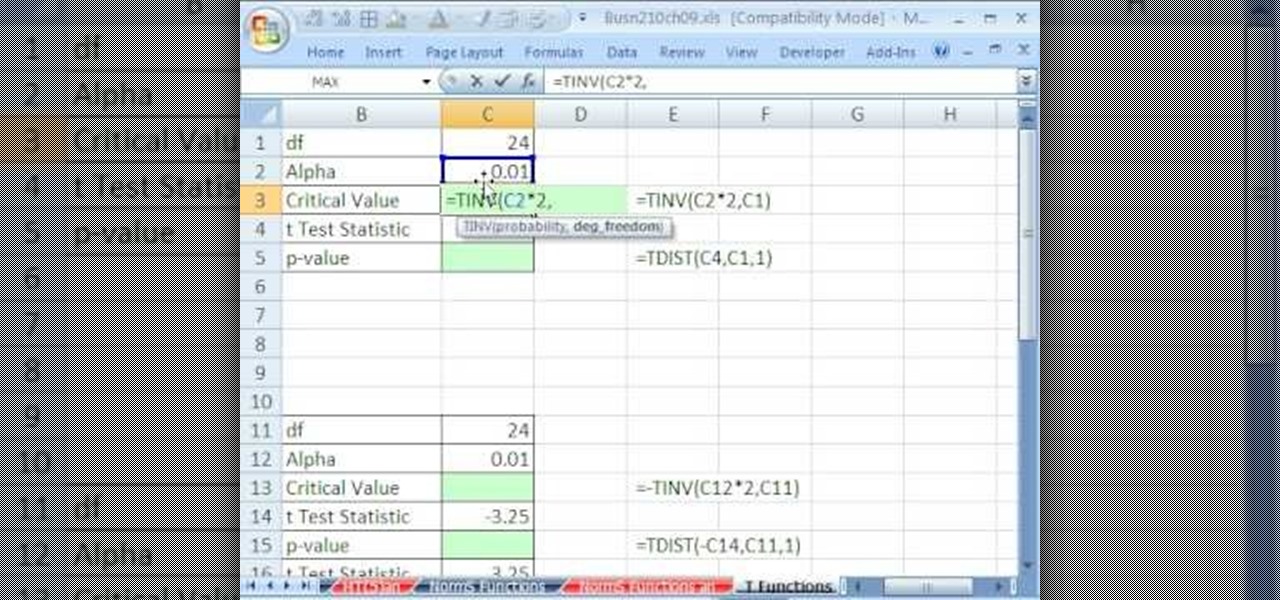
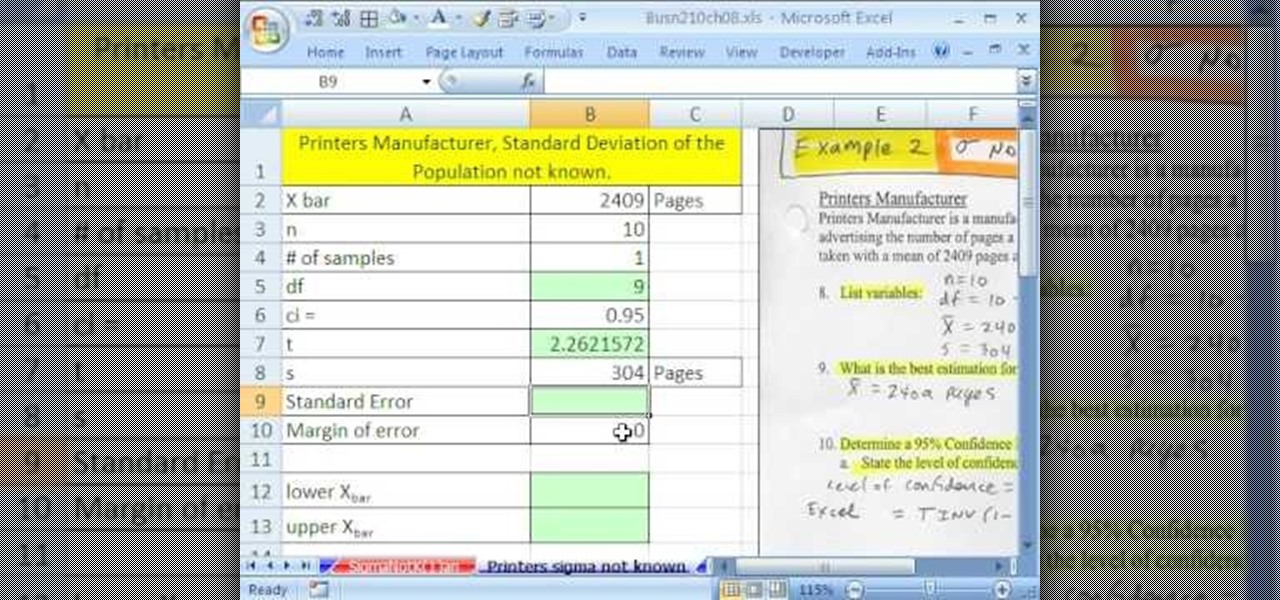
If you use Microsoft Excel on a regular basis, odds are you work with numbers. Put those numbers to work. Statistical analysis allows you to find patterns, trends and probabilities within your data. In this MS Excel tutorial from everyone's favorite Excel guru, YouTube's ExcelsFun, the 91st installment in his "Excel Statistics" series of free video lessons, you'll learn how to use TINV and TDIST functions to find critical values given an unknown sigma value.

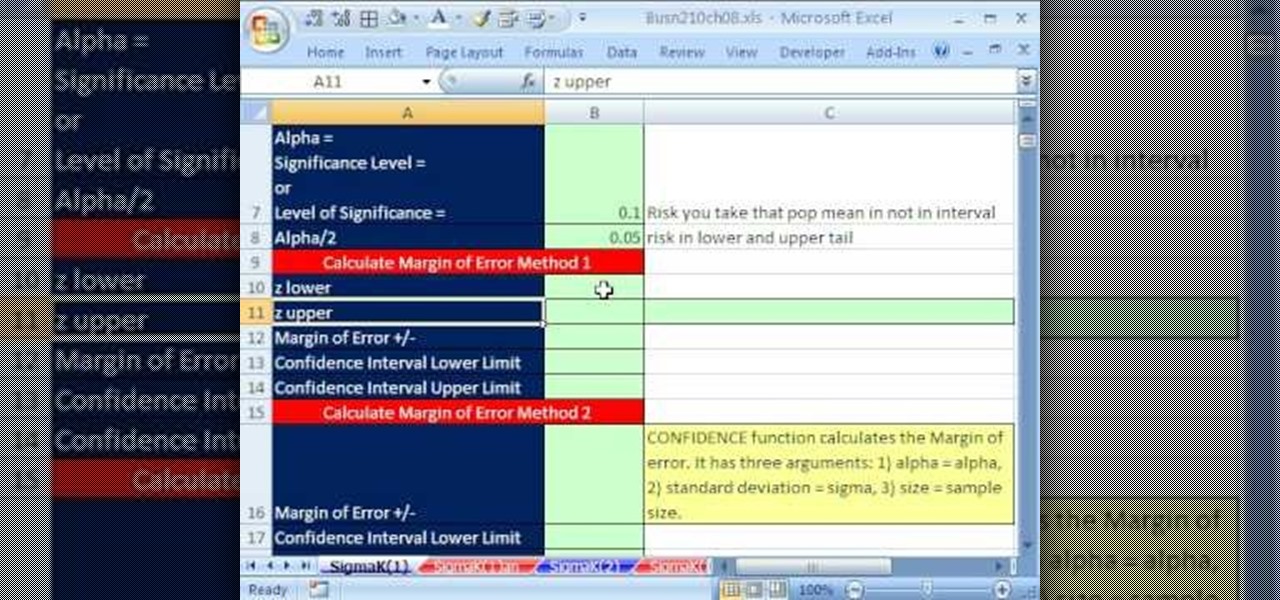
If you use Microsoft Excel on a regular basis, odds are you work with numbers. Put those numbers to work. Statistical analysis allows you to find patterns, trends and probabilities within your data. In this MS Excel tutorial from everyone's favorite Excel guru, YouTube's ExcelsFun, the 80th installment in his "Excel Statistics" series of free video lessons, you'll learn how to construct confidence intervals when the sigma is known known using the CONFIDENCE and NORMSINV functions.

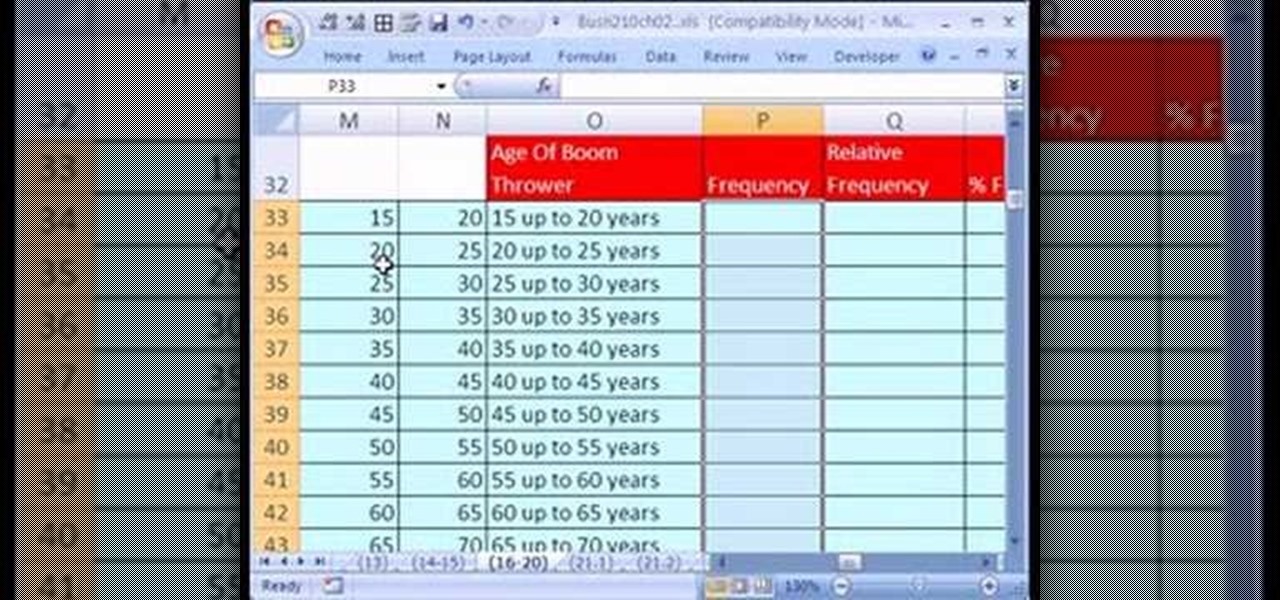
If you use Microsoft Excel on a regular basis, odds are you work with numbers. Put those numbers to work. Statistical analysis allows you to find patterns, trends and probabilities within your data. In this MS Excel tutorial from everyone's favorite Excel guru, YouTube's ExcelsFun, the 21st installment in his "Excel Statistics" series of free video lessons, you'll learn how to build labels and counting formulas for a frequency distribution.

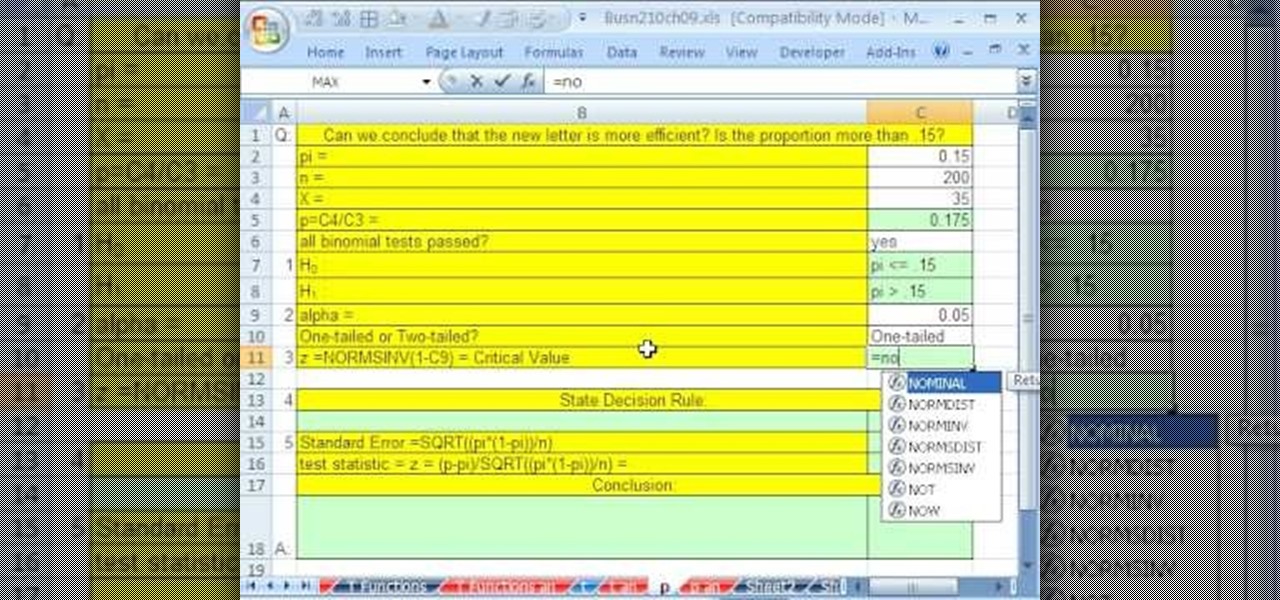
If you use Microsoft Excel on a regular basis, odds are you work with numbers. Put those numbers to work. Statistical analysis allows you to find patterns, trends and probabilities within your data. In this MS Excel tutorial from everyone's favorite Excel guru, YouTube's ExcelsFun, the 87th installment in his "Excel Statistics" series of free video lessons, you'll learn how to use NORMSINV to test a hypothesis with population standard deviation (sigma) known and proportions.

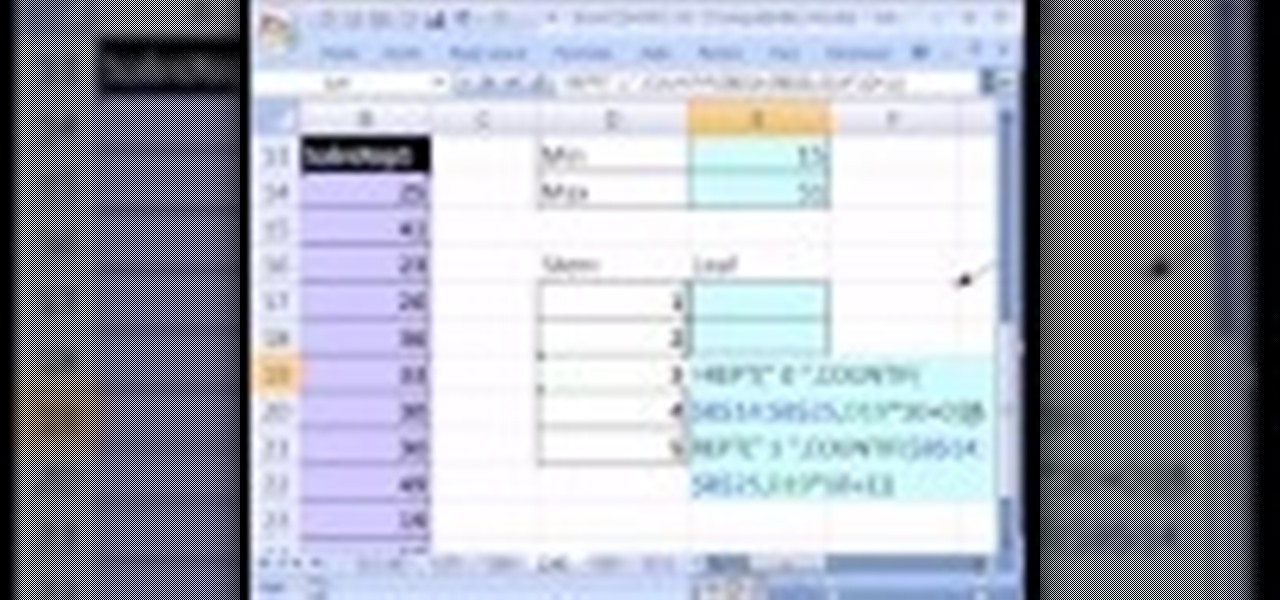
If you use Microsoft Excel on a regular basis, odds are you work with numbers. Put those numbers to work. Statistical analysis allows you to find patterns, trends and probabilities within your data. In this MS Excel tutorial from everyone's favorite Excel guru, YouTube's ExcelsFun, the 28th installment in his "Excel Statistics" series of free video lessons, you'll learn how to create quantitative data stem & leaf charts using the REPT and COUNTIF functions.

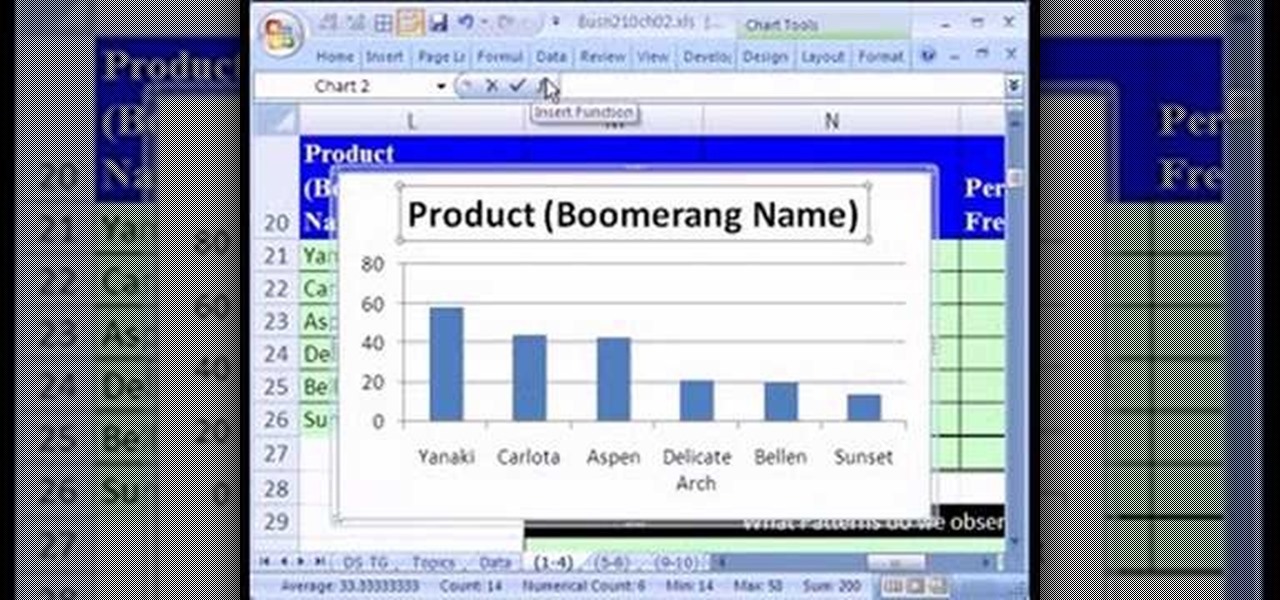
If you use Microsoft Excel on a regular basis, odds are you work with numbers. Put those numbers to work. Statistical analysis allows you to find patterns, trends and probabilities within your data. In this MS Excel tutorial from everyone's favorite Excel guru, YouTube's ExcelsFun, the 13th installment in his "Excel Statistics" series of free video lessons, you'll learn how to create a column chart from a frequency distribution for categorical data.

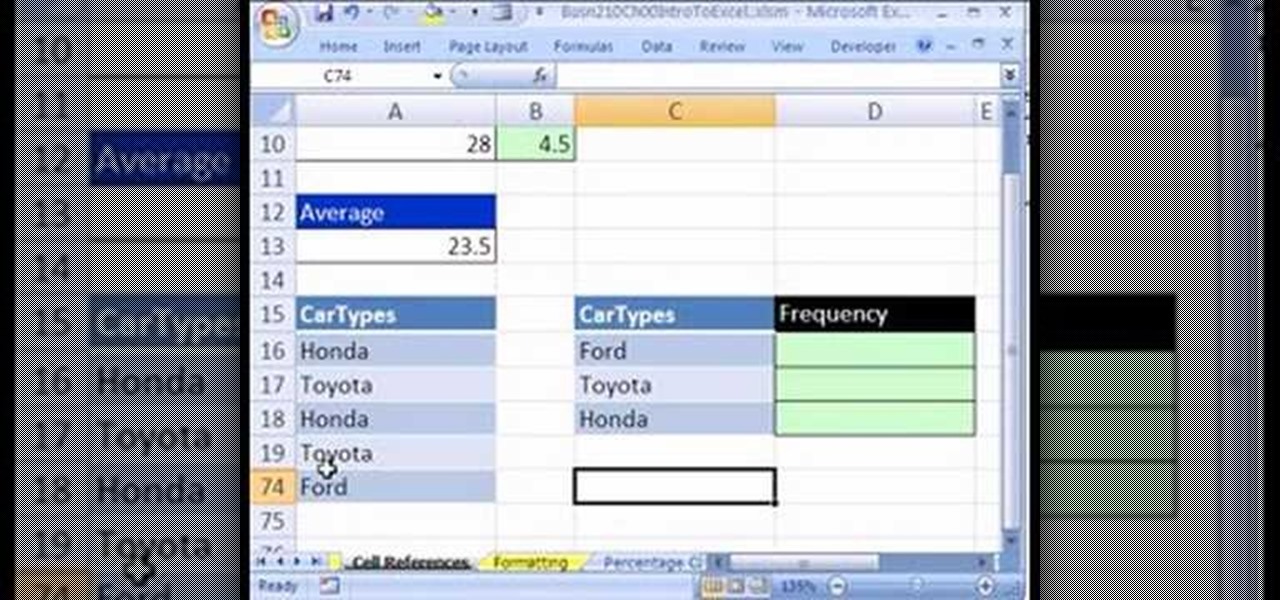
If you use Microsoft Excel on a regular basis, odds are you work with numbers. Put those numbers to work. Statistical analysis allows you to find patterns, trends and probabilities within your data. In this MS Excel tutorial from everyone's favorite Excel guru, YouTube's ExcelsFun, the 5th installment in his "Excel Statistics" series of free video lessons, you'll learn how to use relative and absolute cell references to save time when writing formulas.

Need some help improving your golf game? Ever hear of stack and tilt? Want to learn what all the fuss is about? Check out Brady Riggs’ analysis of Eric Axley’s full swing and find out about the “stack & tilt” technique. See exactly how to do this golf move for a better golf swing.

The Nessus vulnerability scanner, is the world-leader in active scanners, featuring high speed discovery, configuration auditing, asset profiling, sensitive data discovery and vulnerability analysis of your security posture. Nessus scanners can be distributed throughout an entire enterprise, inside DMZs, and across physically separate networks. In this network security video tutorial, you'll learn how to hack a network using Nessus 3.

These aren't your mother's bake sale pies. In fact, they're not really pies at all. Rather, these delicious and pretty treats are cupcakes decorated like pies. A simple concept, yes, but these cupcakes make for a divine arrangement. You'll learn how to arrange various colors of jelly jeans to look like food - red for strawberries and blue for blueberries, for instance.

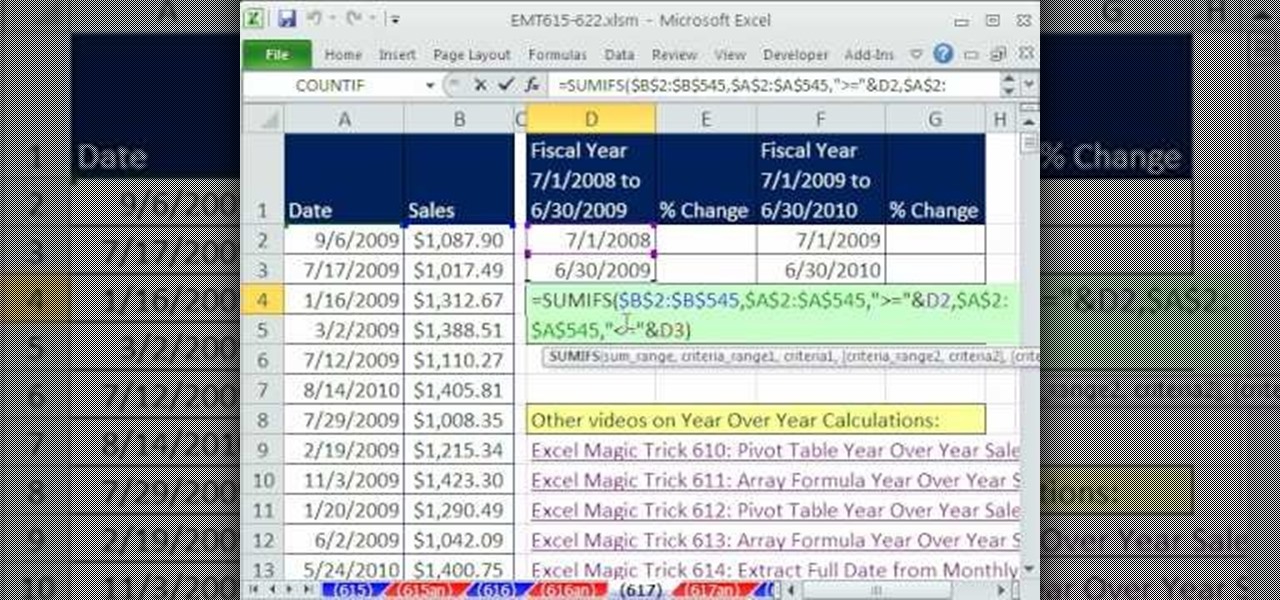
New to Microsoft Excel? Looking for a tip? How about a tip so mind-blowingly useful as to qualify as a magic trick? You're in luck. In this MS Excel tutorial from ExcelIsFun, the 617th installment in their series of digital spreadsheet magic tricks, you'll learn how see a SUMIFS and SUMPRODUCT functions formula to sum the fiscal year's sales when the year does not end on December 31st. Also see a formula for year-over-year percentage change.

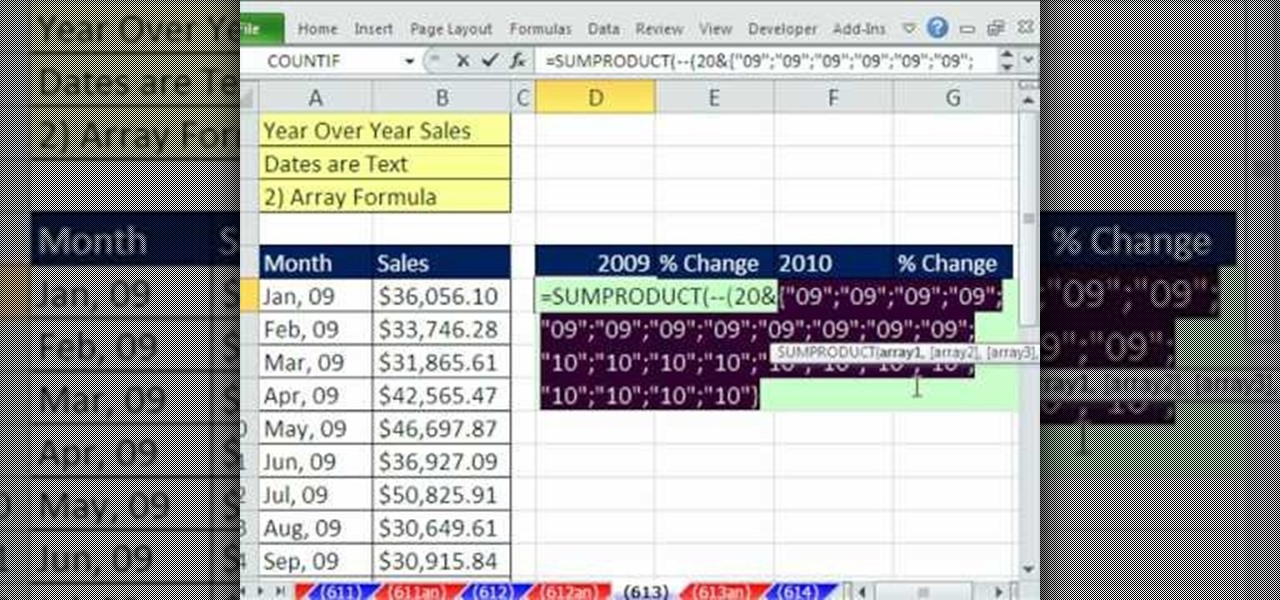
New to Microsoft Excel? Looking for a tip? How about a tip so mind-blowingly useful as to qualify as a magic trick? You're in luck. In this MS Excel tutorial from ExcelIsFun, the 613th installment in their series of digital spreadsheet magic tricks, you'll learn how to

You don't need to work as an executive at Google to understand and appreciate the importance of large-scale data analytics in today's world. Whether you're interested in joining the ranks of a major tech firm or want to improve your company's marketing campaigns through consumer analysis, knowing how to work with large sets of complex data is paramount.

The term "hacker" often has negative associations attached to it, yet the world is in dire need of professionals with hacking skills. White hat hackers are ethical computer hackers that use their hacking skills to pinpoint network vulnerabilities and patch them up before they can be exploited by the bad guys.

Creativity is one of our most unique features. We can dream up gods and demons and give them form through drawing. We can even take a two-dimensional surface and bring our ideas to life in three dimensions. It only takes a little training for our giant imaginations to blossom on the page.

Few things are more important than search engine optimization when it comes to increasing a brand's visibility online. Regardless of whether you're launching a new business from scratch or working as a marketing professional at a major corporation, you need to ensure that you're drawing the most people to your website and affiliate links by utilizing the latest and most powerful SEO tools and methods.

Before the internet, acquiring enough data to analyze was challenging. Now we have the opposite problem: a deluge of data makes trying to sort through it nearly impossible. That's where data science comes in.

The week of the annual Consumer Electronics Show is supposed to be filled with good news for the augmented reality industry as AR headset and smartglasses makers show off their new wares.

According to Digi-Capital, investors poured $1.8 billion into augmented and virtual reality companies over the last 12 months, including $300 million in the third quarter. These investments are not made without a means to monetize products and services.

In this video, Derrick Schommer, sales engineer, podcaster and host of Common Man Cocktails shows viewers how to mix up a Blue Mediterranean. This classy gin cocktail is based on Bombay Sapphire gin, teamed with lemon-and-lime Sprite and Blue Curacao for a sophisticated, slightly sweet drink. The Blue Curacao and gin are placed in a high-ball glass with ice, then the drink is topped off with Sprite and a squeeze of fresh lemon juice.

Welcome to a tennis lesson from FuzzyYellowBalls, the the best place to learn how to play tennis online. Our free video tennis lessons teach you how to play the game in a new way that combines technical analysis, visual learning, and step-by-step progressions.

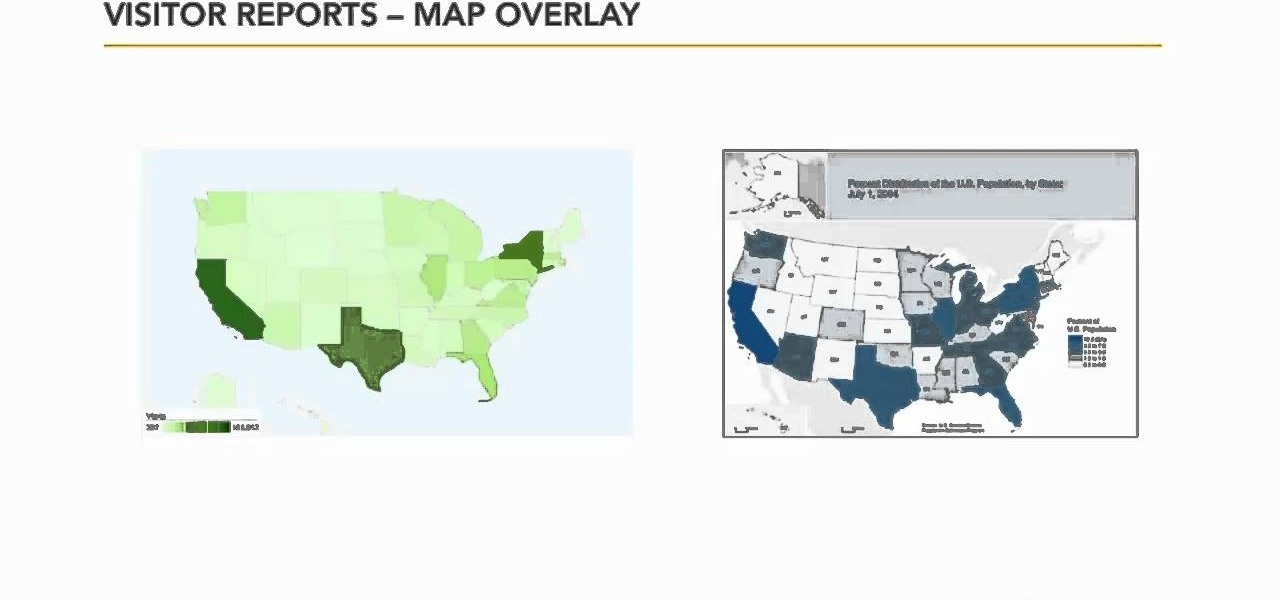
In this video tutorial, we learn how to use the Map Overlay feature when using the Google Analytics web tracking service. Whether you're new to Google's popular web analytics platform or a seasoned pro merely looking to pick up a few new tips and tricks, you're sure to be well served by this free video tutorial from Lynda.

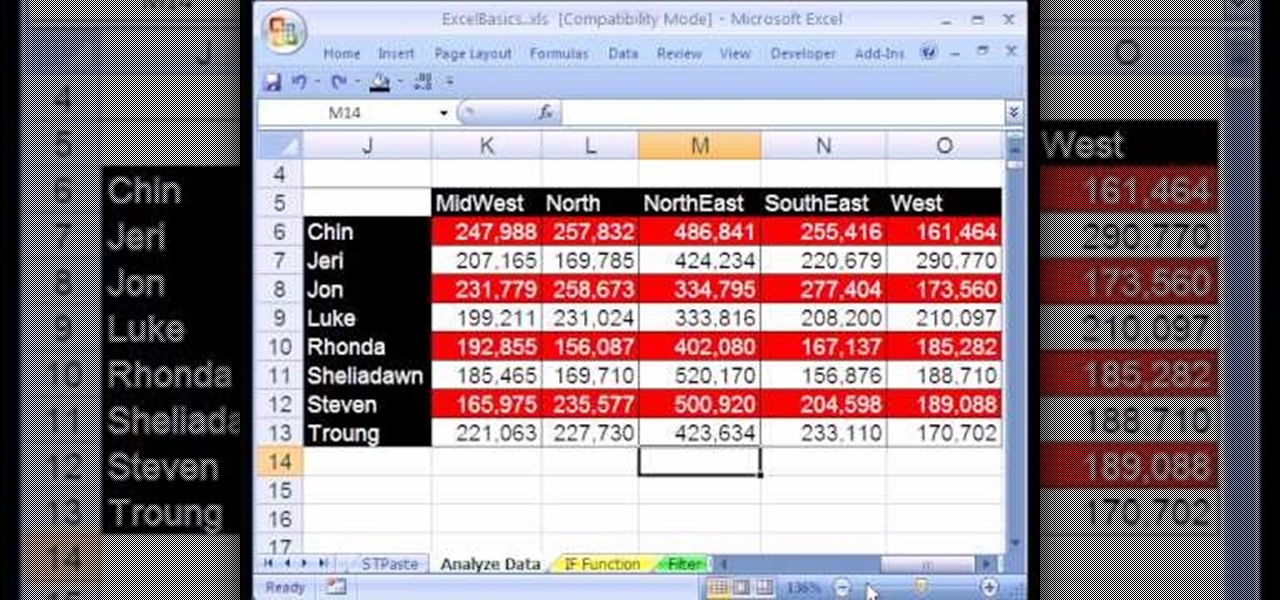
If you're looking to learn how to use Microsoft Excel, a video series from digital spreadsheet guru ExcelIsFun is a great place to start. But which of his many series should you choose? The one titled "Excel Basics," that's which! In this free video MS Excel lesson, the 20th installment in said basics series, you'll learn how to use pivot tables (PivotTables) to analyze and summarize data.

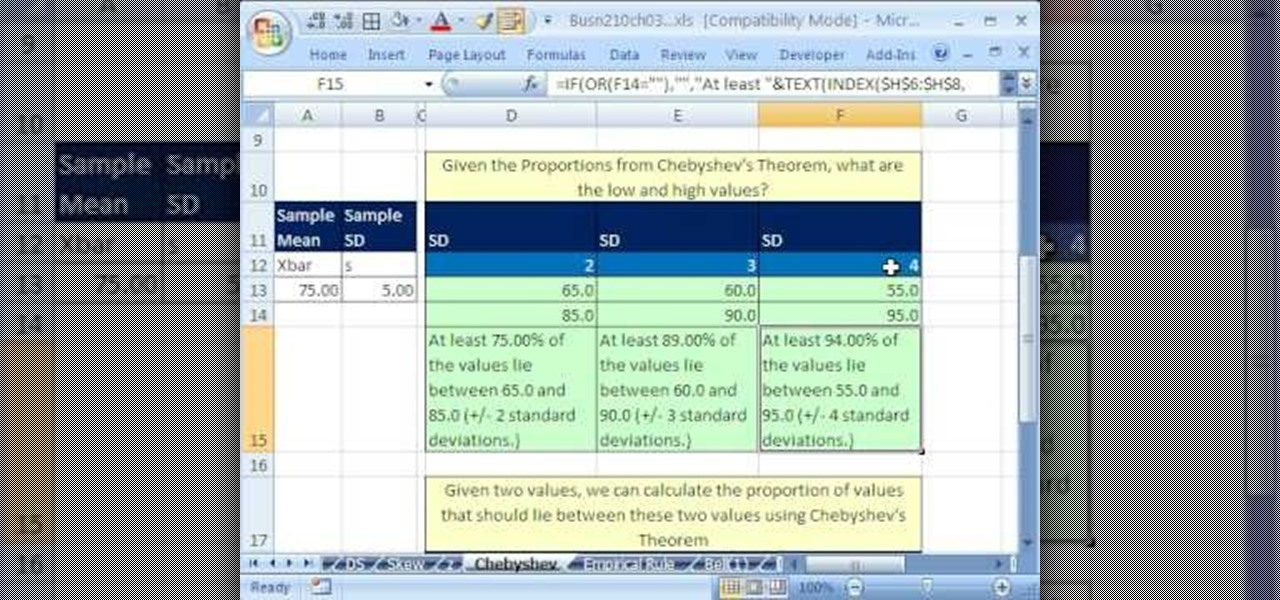
If you use Microsoft Excel on a regular basis, odds are you work with numbers. Put those numbers to work. Statistical analysis allows you to find patterns, trends and probabilities within your data. In this MS Excel tutorial from everyone's favorite Excel guru, YouTube's ExcelsFun, the 48th installment in his "Excel Statistics" series of free video lessons, you'll see comparison of Chebyshev's Theorem and the Empirical Rule (bell curve) and learn when to apply which.

If you use Microsoft Excel on a regular basis, odds are you work with numbers. Put those numbers to work. Statistical analysis allows you to find patterns, trends and probabilities within your data. In this MS Excel tutorial from everyone's favorite Excel guru, YouTube's ExcelsFun, the 46th installment in his "Excel Statistics" series of free video lessons, you'll learn about Chebyshev's Theorem and how to apply it in three different ways.

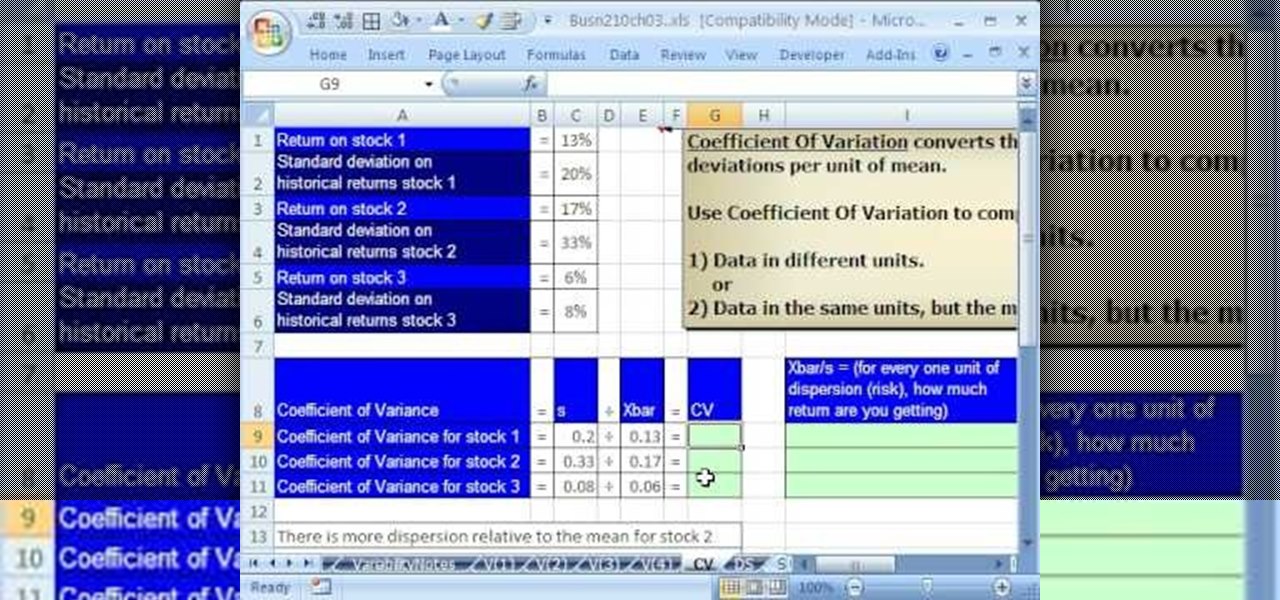
If you use Microsoft Excel on a regular basis, odds are you work with numbers. Put those numbers to work. Statistical analysis allows you to find patterns, trends and probabilities within your data. In this MS Excel tutorial from everyone's favorite Excel guru, YouTube's ExcelsFun, the 42nd installment in his "Excel Statistics" series of free video lessons, you'll learn how to calculate the coefficient of variation.

If you use Microsoft Excel on a regular basis, odds are you work with numbers. Put those numbers to work. Statistical analysis allows you to find patterns, trends and probabilities within your data. In this MS Excel tutorial from everyone's favorite Excel guru, YouTube's ExcelsFun, the 30th installment in his "Excel Statistics" series of free video lessons, you'll learn how to create a scatter diagram for 2 quantitative variables.

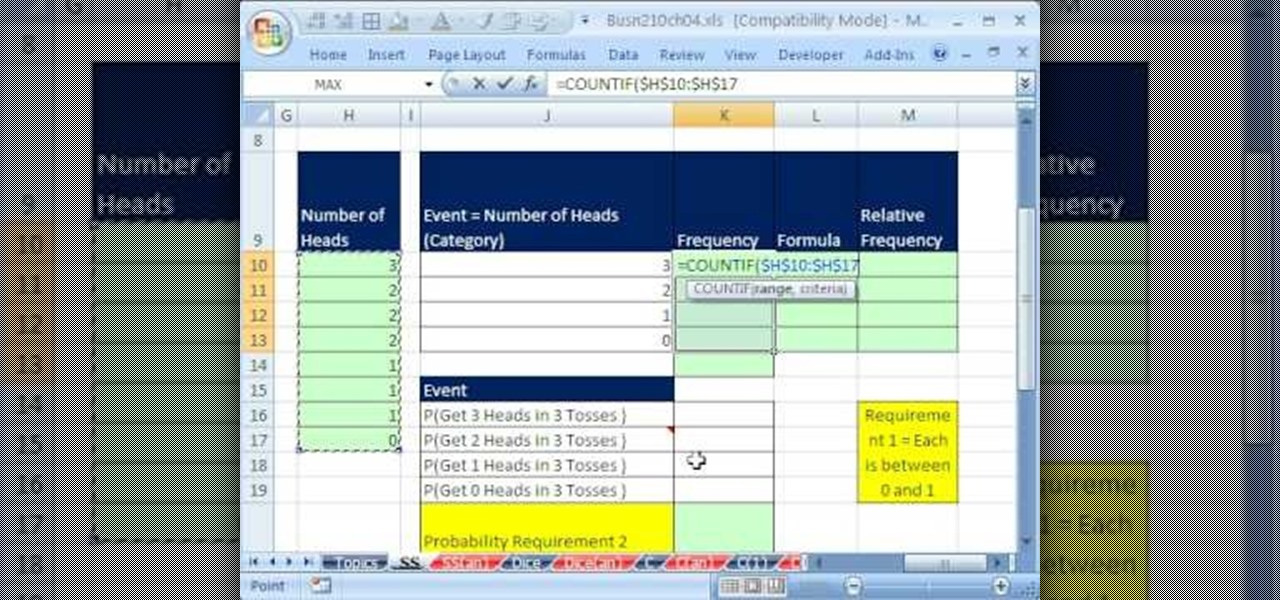
If you use Microsoft Excel on a regular basis, odds are you work with numbers. Put those numbers to work. Statistical analysis allows you to find patterns, trends and probabilities within your data. In this MS Excel tutorial from everyone's favorite Excel guru, YouTube's ExcelsFun, the 51st installment in his "Excel Statistics" series of free video lessons, you'll learn how to understand, work with and find simple probabilities in Microsoft Office Excel.

If you use Microsoft Excel on a regular basis, odds are you work with numbers. Put those numbers to work. Statistical analysis allows you to find patterns, trends and probabilities within your data. In this MS Excel tutorial from everyone's favorite Excel guru, YouTube's ExcelsFun, the 93rd installment in his "Excel Statistics" series of free video lessons, you'll learn how to use the NORMSINV and NORMSDIST functions to complete a hypothesis test about a population proportion.

If you use Microsoft Excel on a regular basis, odds are you work with numbers. Put those numbers to work. Statistical analysis allows you to find patterns, trends and probabilities within your data. In this MS Excel tutorial from everyone's favorite Excel guru, YouTube's ExcelsFun, the 83rd installment in his "Excel Statistics" series of free video lessons, you'll learn how to construct confidence intervals when the sigma (population standard deviation) in NOT known using the TINV function.


