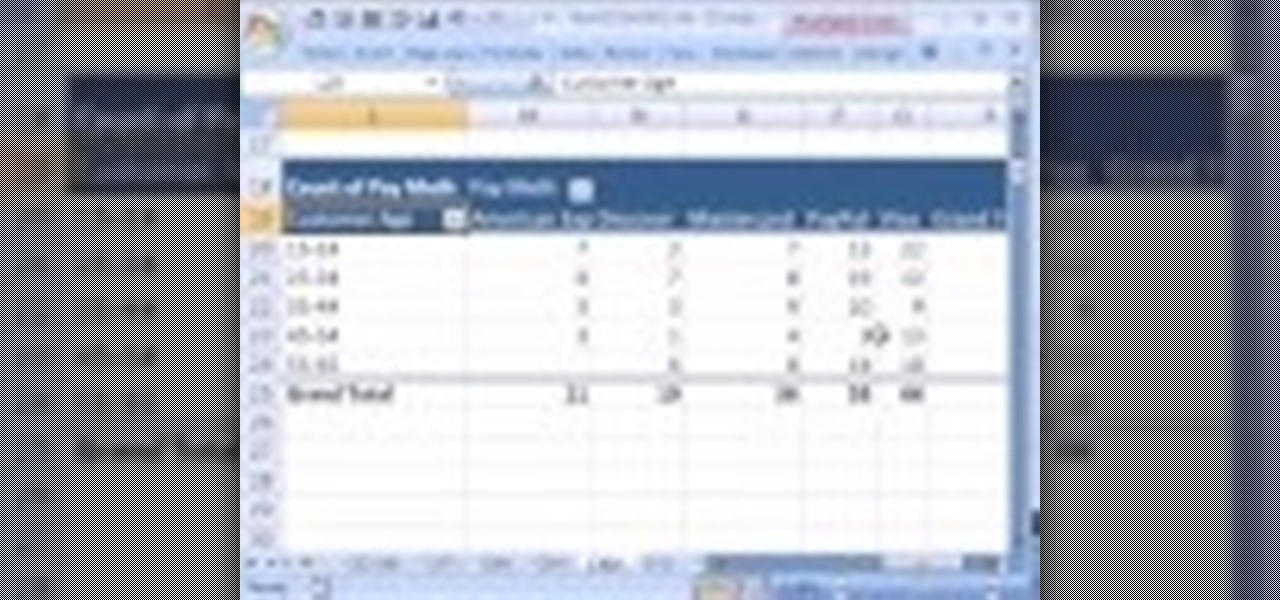
If you use Microsoft Excel on a regular basis, odds are you work with numbers. Put those numbers to work. Statistical analysis allows you to find patterns, trends and probabilities within your data. In this MS Excel tutorial from everyone's favorite Excel guru, YouTube's ExcelsFun, the 29th installment in his "Excel Statistics" series of free video lessons, you'll learn how to create quantitative data cross tabulation using a pivot table (PivotTable).
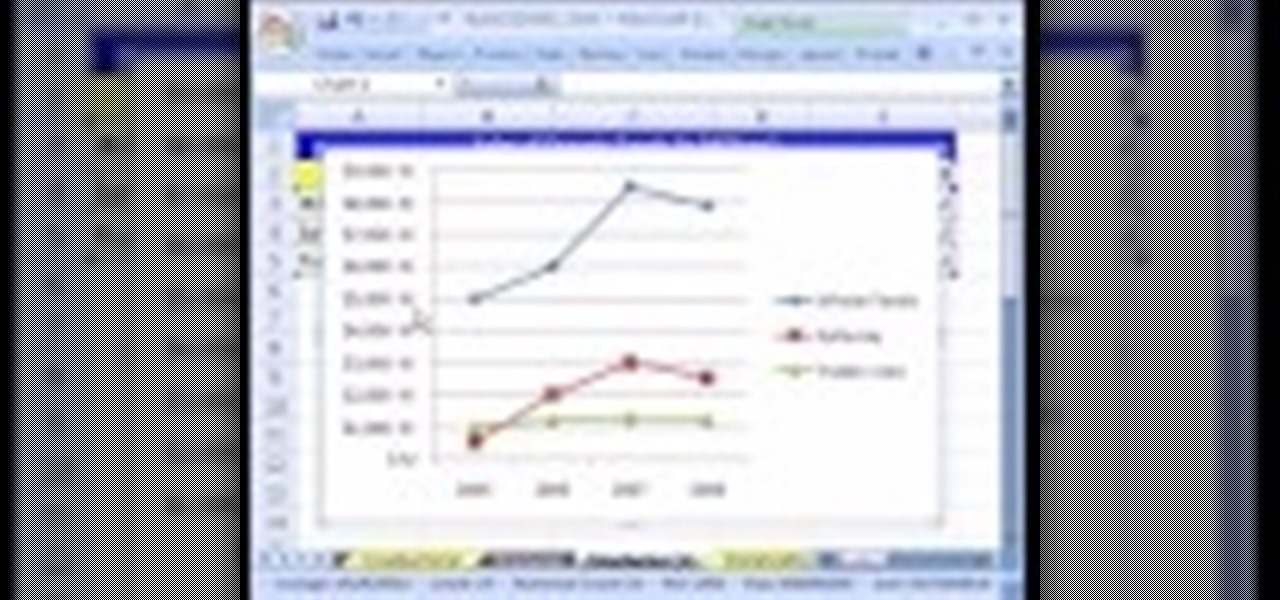
If you use Microsoft Excel on a regular basis, odds are you work with numbers. Put those numbers to work. Statistical analysis allows you to find patterns, trends and probabilities within your data. In this MS Excel tutorial from everyone's favorite Excel guru, YouTube's ExcelsFun, the 11th installment in his "Excel Statistics" series of free video lessons, you'll learn how to work with, and create charts for, cross-sectional and time-series data.
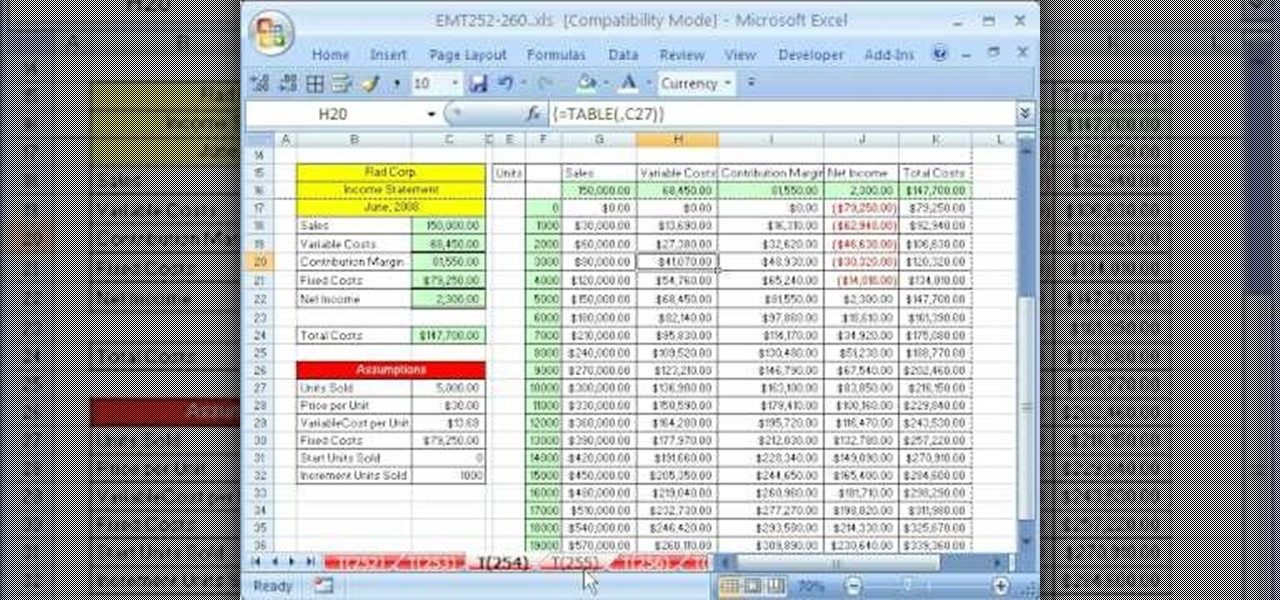
New to Microsoft Excel? Looking for a tip? How about a tip so mind-blowingly useful as to qualify as a magic trick? You're in luck. In this MS Excel tutorial from ExcelIsFun, the 254th installment in their series of digital spreadsheet magic tricks, you'll learn how to do contribution margin income statement analysis across various units using a one-variable data table.
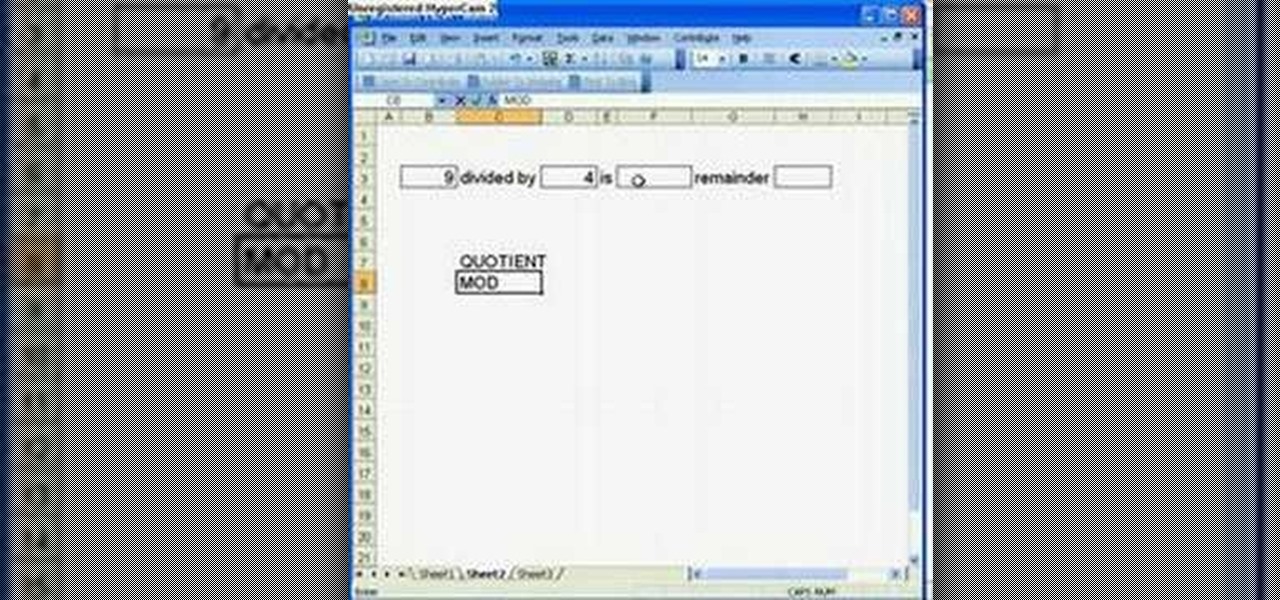
Microsoft Office Excel 2007 spreadsheet manager is a powerful tool that enables information workers to format spreadsheets, as well as analyze and share information to make more informed decisions. In this MS Excel video tutorial, you'll learn about the QUOTIENT and MOD functions. Note that, in urder to use these functions, you'll need to install the analysis ToolPak. For more information, watch this Excel how-to.

This video is a step-by-step analysis of each of the moves of the first bo kata, shu shi no kon, including what attack you are blocking and striking point on the opponent. A great way to learn these moves.

This video shows you how to perform timbei kata and gives an analysis (bunkai) of the timbei and rochin.

This video breaks down the kata, or form, utilizing the kama, the okinawan sickle. The second video gives an analysis (bunkai) of the kata. An excellent series that makes it easy to learn from.

San-cho zai is kata with three sai. This two part video shows you how to perform san-cho zai and then gives a more detailed explaination or analysis (called bunkai).

This video gives an analysis of second bo kata, cho un no kon and shows you how it is executed.

This video gives an analysis of strikes and blocks from the more advanced hojo-undo (but still the basics prior to a kata).

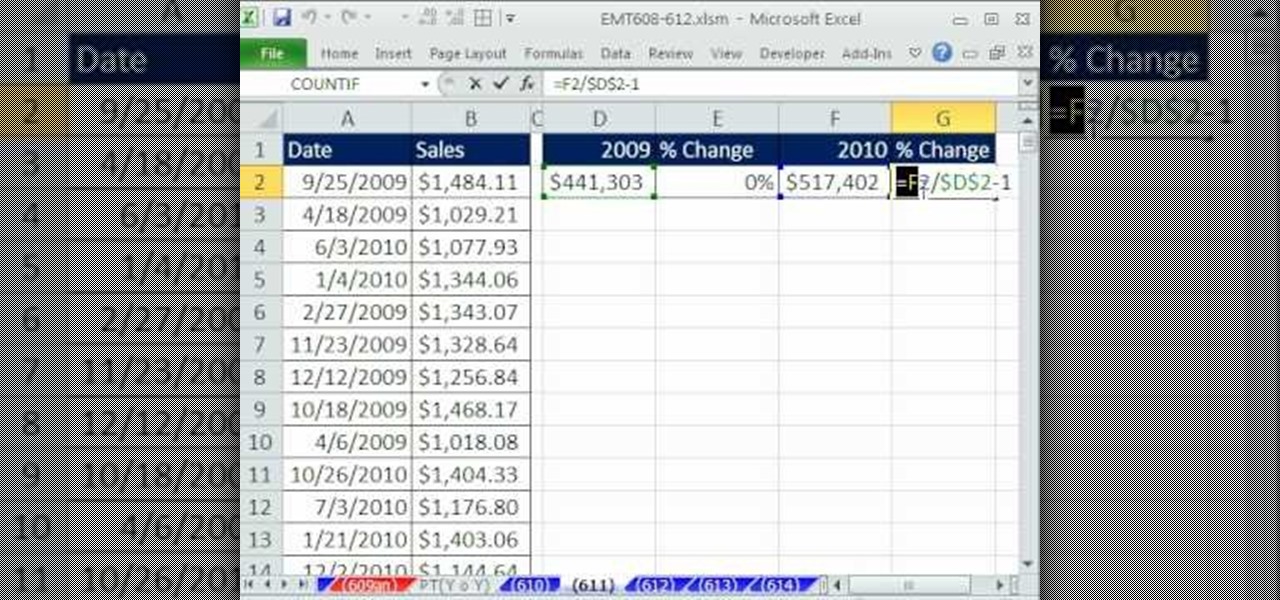
New to Microsoft Excel? Looking for a tip? How about a tip so mind-blowingly useful as to qualify as a magic trick? You're in luck. In this MS Excel tutorial from ExcelIsFun, the 611th installment in their series of digital spreadsheet magic tricks, you'll learn how to create an array formula to summarize year over year sales using the SUMPRODUCT and YEAR functions. Also see how to calculate a formula for percentage change.

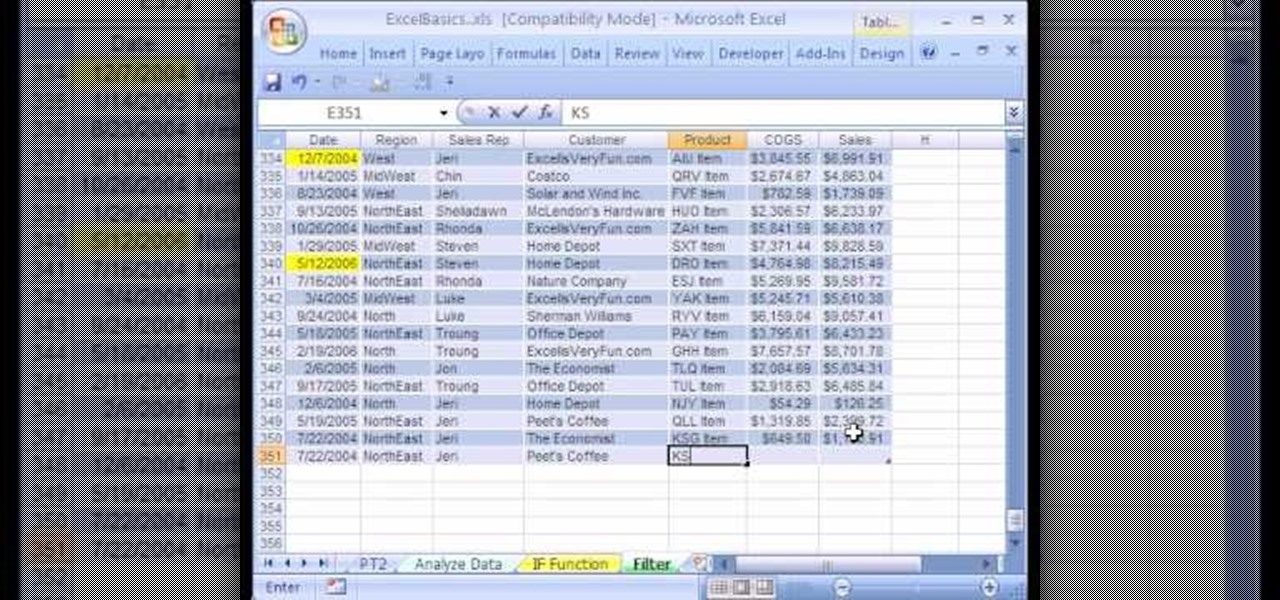
We're on sheet, tab, filter. We want to talk about filter, but we also want to talk about an Excel table or list. It is simply a data set with field names at the top, records in rows, no blanks anywhere and no other data sets touching this data set. When we convert to a table, it does a lot of amazing things. The new keyboard shortcut is "Ctrl T". If data is set up correctly, it will work. Click Ok. You can build a function based on a column of data, i.e. "Alt =" which is the shortcut for sum...

A handful of retailers have put the newest Nexus smartphones on sale again, so you're in luck if you missed out on picking one up during the discount period last month. Actually, you might be better off since some retailers are giving away freebies with some models, too.

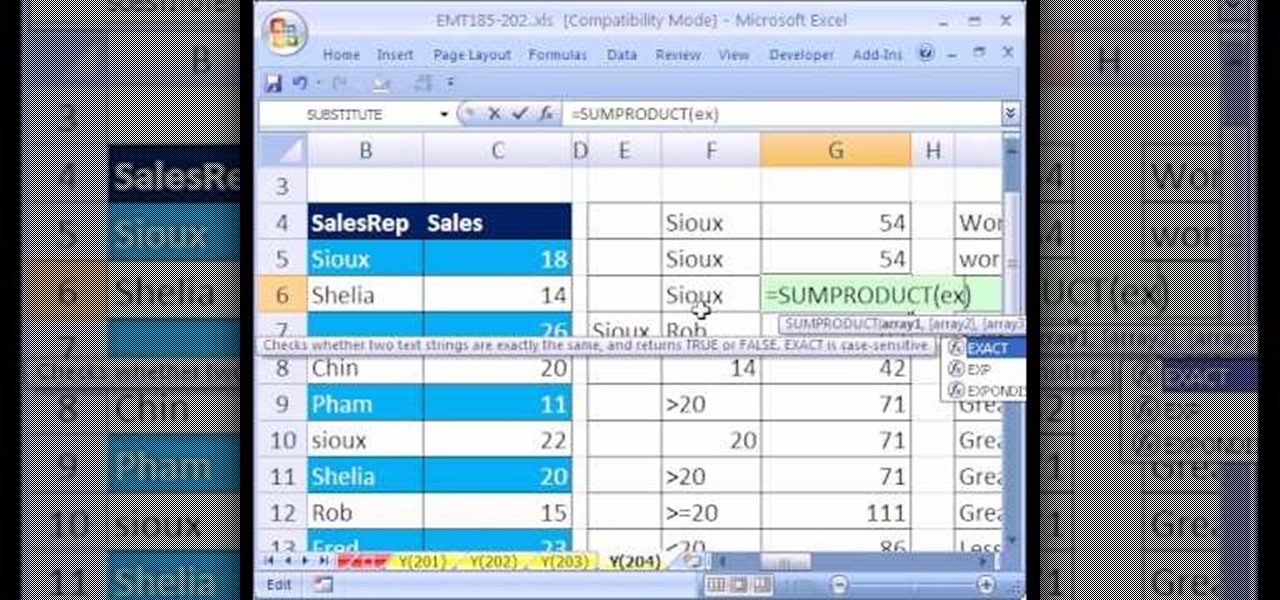
New to Microsoft Excel? Looking for a tip? How about a tip so mind-blowingly useful as to qualify as a magic trick? You're in luck. In this MS Excel tutorial from ExcelIsFun, the 204th installment in their series of digital spreadsheet magic tricks, you'll learn how to use the SUMPRODUCT and EXACT functions in an array formula to add the sales for a sales representative where lower and upper letters matter (i.e., are case sensitive) in the criteria (conditions).

This video is about staging a home for sale. Bridget Kiene, a real estate broker, describes home staging and its significance. Bridget starts with defining home staging and mentions that 92 percent of people advertise their house for sale on the internet. This video also has some tips on home staging, such as, always stage an empty house, create a neutral color palette, eliminate clutter and modernize your decorations. Bridget clearly explains the basic steps we need to follow to sell a house...

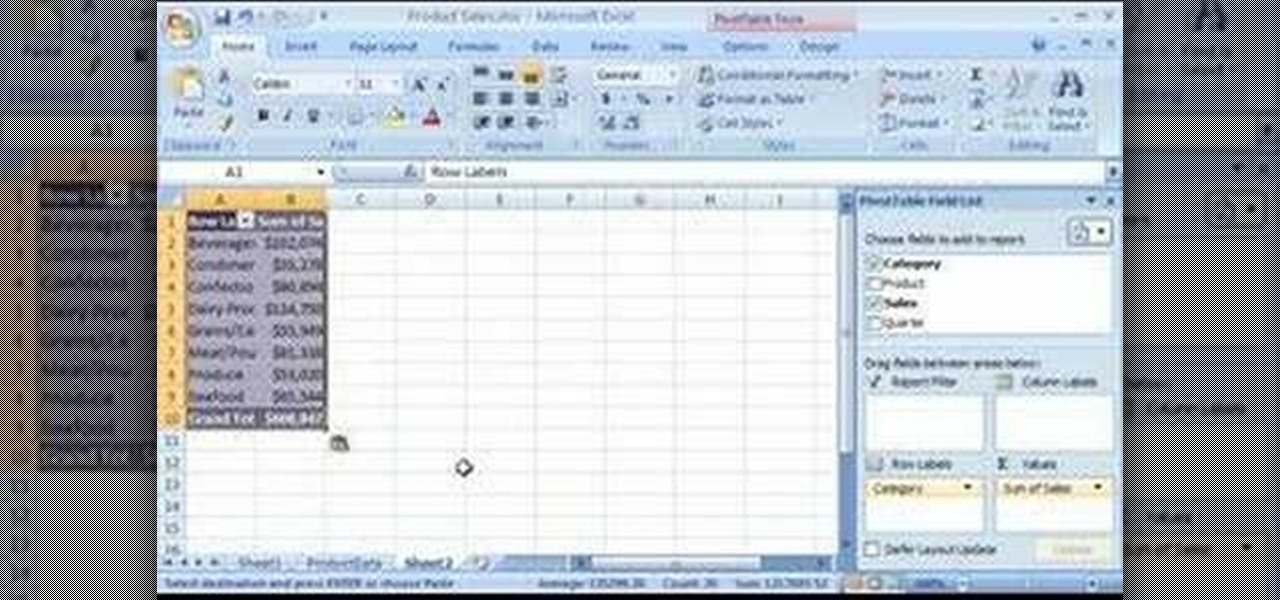
With PivotTable reports in Microsoft Office Excel 2007, your sales report will sparkle with power, flair, and functionality. Take a look at this instructional video to learn how to show the big picture, show all the details, or show anything in between. Easily create multiple worksheets to switch back and forth between the various versions of your report. Sort, filter, and summarize your data any way you like. Show the details of any summary value in your report.

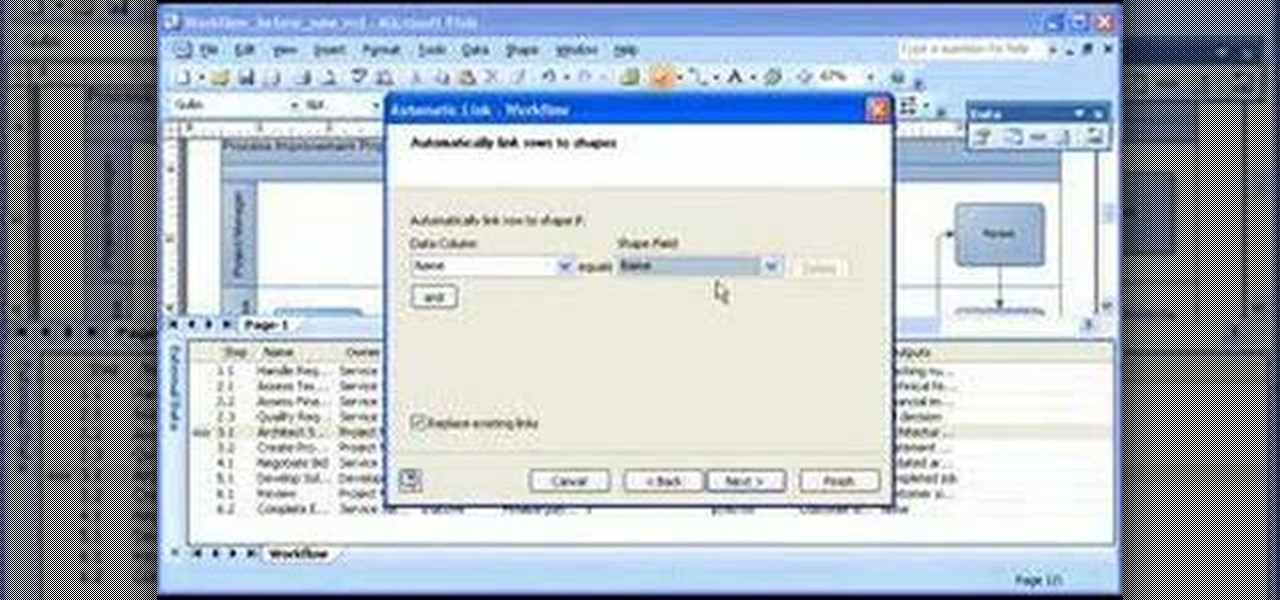
Take a look at this instructional video and learn how to analyze how a process or other area is actually performing by connecting data to the shapes in your diagram with Microsoft Visio 2007. You can also add different visual effects based on the data values. For example, you can link sales data from an Excel workbook to the shapes it relates to. When a phase of the sales process takes longer than guidelines recommend, the shape for that phase changes color or shows an icon that alerts you to...

Let's face it, iPhones are expensive. With the latest iPhone XS Max reaching as high as $1,449, our wallets could all use a little support. That's where Black Friday comes in, supplying us with deals and discounts on iPhones of all kinds. If you're looking for a new iPhone this holiday season without having to break the bank, you've come to the right place.

Aura, a highly rated app for mindfulness and mental health, just became available on Android and is currently on sale.

The rumor that the iPhone 8 will ship with 3D camera system is not a new one, but a new analysis by Morgan Stanley's Charlie Chan lends credibility to the speculation. Now, it appears more likely than ever that Apple's next iPhone will ship with 3D capabilities, increasing potential for AR and VR integration in the future.

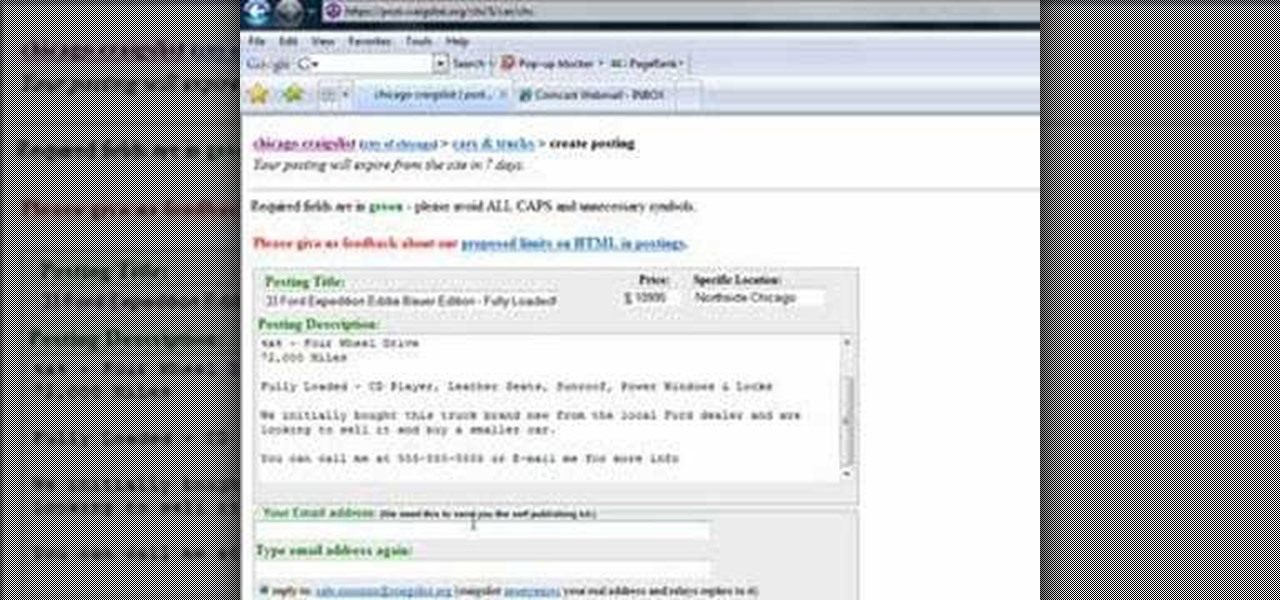
This six minute video shows you how to sell your car on craigslist. First, go to craigslist.com and click on the nearest city (or country). Follow the links to list an ad for a car for sale. You will want to put the kind of car in the posting title because that is used in sorting search results. In the posting description it is important to be as specific as possible - again describing the car, giving some history of the car like if it has ever been in an accident and if you have had any work...

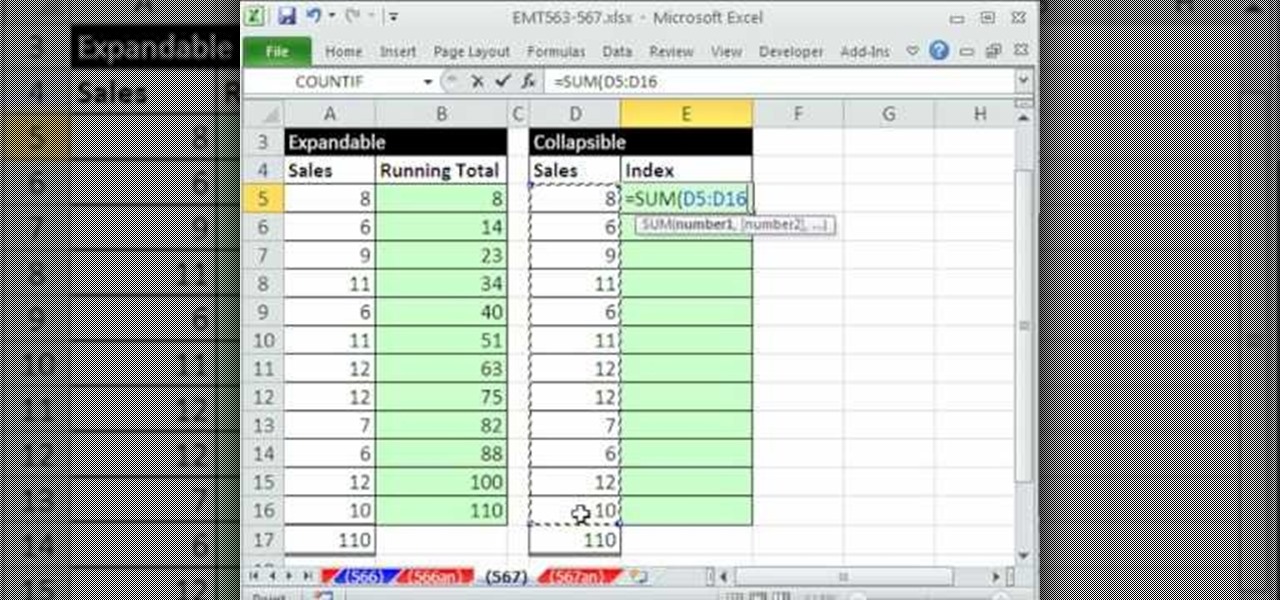
This video demonstrates how to create collapsible and expandable cell ranges in Excel. The first thing that you will have to is to prepare your Excel worksheet that contains the data which you need to be expandable and collapsible. On the first cell under your Running Total column, type in the function, "=SUM". Select the Sales cell corresponding to that cell then type in Shift+Colon. Click on the first value and hit the F4 key to lock your row reference. The result will automatically show. Y...

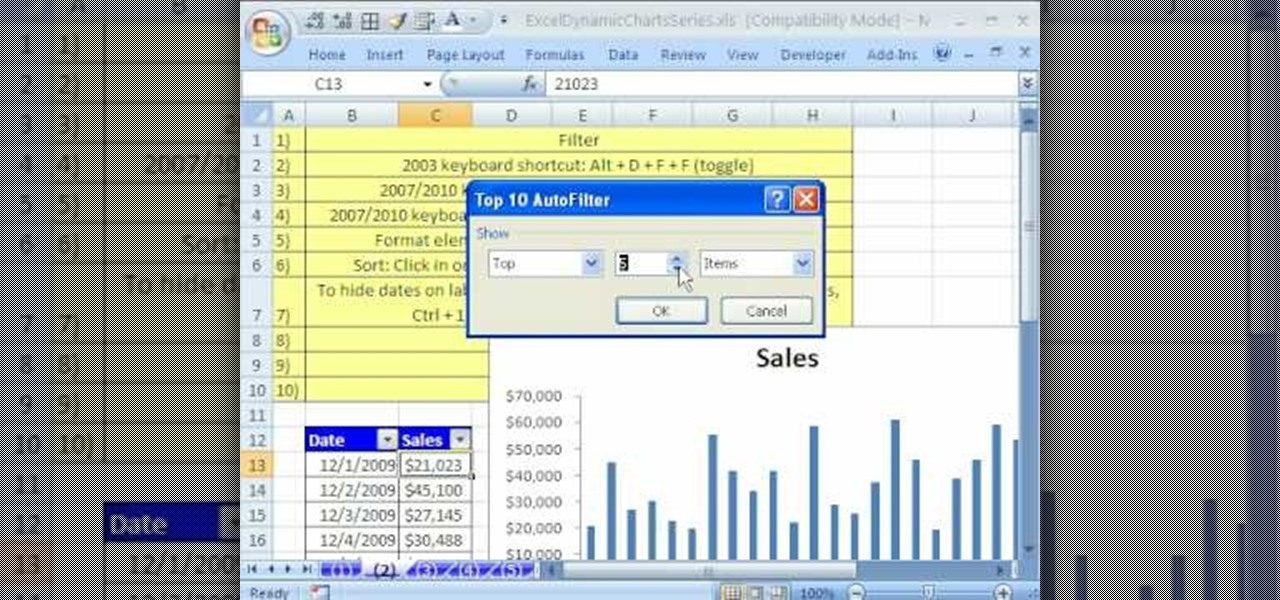
In this Software video tutorial you will learn how to use the filter & sort feature in Excel. First create a column chart on an excel sheet. In this example, it is a date and sales chart. Click alt+F1 and the chart is displayed. Then click and delete the legend and the horizontal lines. Now go back to the data set, click on a cell and click ctrl+shift+L and that will add the auto filter. ctrl+shift+L is for Excel 07. For earlier versions, see the commands listed in the video. This is a toggle...

Want to fulfill your dream of becoming an ice cream truck driver? If the idea of rolling around in the sunshine selling ice cream sounds good to you, here's what you need to do.

A little planning is all it takes to decorate your dorm with style! You Will Need

Data analytics is crucial to the operations of every modern business. This trend is going to continue: in three years, 71% of global enterprises predict a rapid increase in data analytics. Experienced professionals that can project manage data initiatives are in high demand.

While the stock market can be unpredictable, it's not a complete enigma. There are patterns to watch for that can make you a successful trader. Fortunately, there is an expert guide to becoming an analyst that's now available to everyone.

Although all signs points to Microsoft releasing a new HoloLens in the coming days, the company is nevertheless looking to distribute its augmented reality apps to other operating systems.

A spokesperson from the Nissan and Renault Alliance told Driverless the group is testing self-driving electric "robo-vehicles" for future mobility services and is "not ruling out anything" for future services the group might offer, as the alliance widens its driverless business model to include both fleets and private sales.

Onshore, or on a boat, have you ever wondered what swims below in the dark water? Using standard equipment and a new process, marine scientists can now get a good look at what is swimming by—just by analyzing the water.

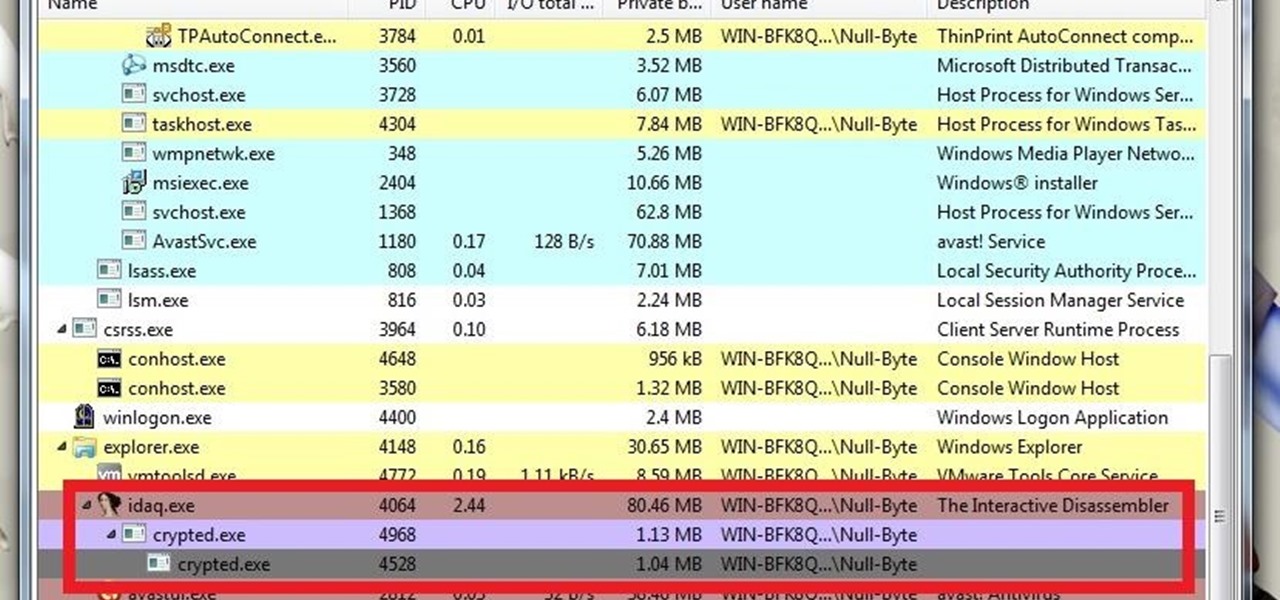
What's up guys? Welcome to a sort of general walkthrough on how one might approach a reversing and analysis on a crypted malware. This is by no means a universal technique so don't assume that this will occur in every scenario, it's more of a demonstration than anything really.

Welcome back, my budding hackers! One of the most basic skills the forensic investigator must master is the acquisition of data in a forensically sound manner. If data is not captured in a forensically sound manner, it may not be admissible in court. In my Kali Forensics series, I showed you how to acquire a forensically sound, bit-by-bit image of a storage device such as a hard drive or flash drive, but now let's dive into live memory.

Chances are that if you've attended any amount of Victoria's Secret's semi-annual sales, you've probably got enough bras to start your own lingerie store. But because you don't have an entire showroom to store those babies, your bras are probably just lying around wherever they fit.

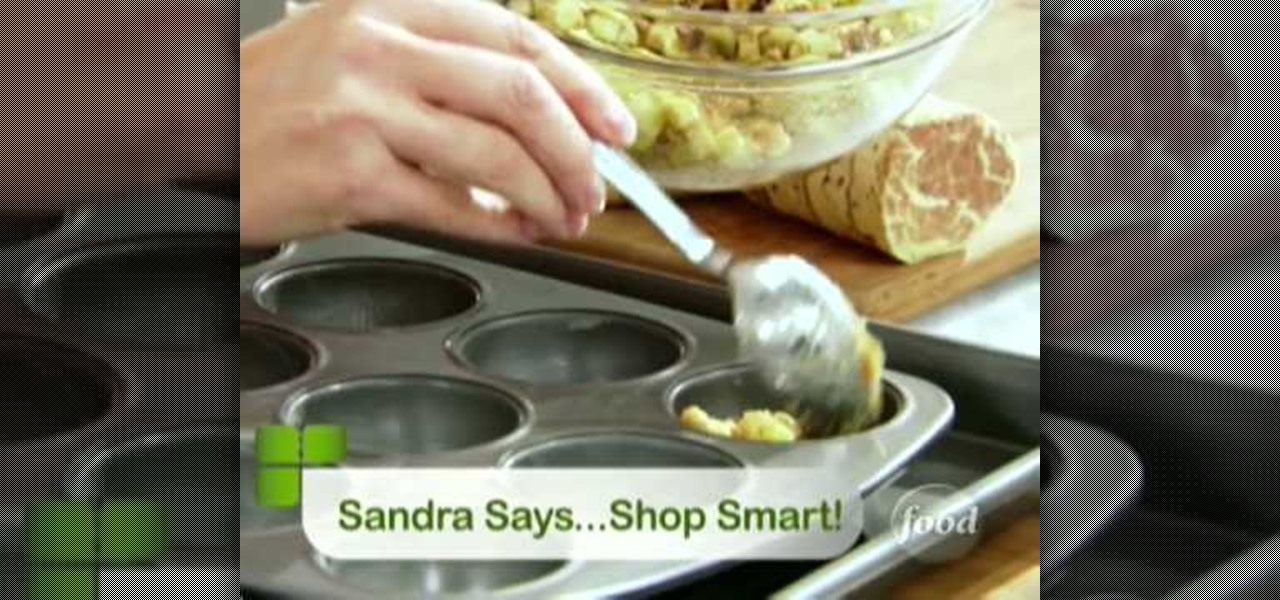
In this clip, Sandra Lee shows you how to do what she does best and make a delicious recipe for very little money. Sandra shows you how to combine homemade ingredients with store bought items so that it tastes like it was made from scratch. Enjoy these sinfully decadent breakfast pastries for your guests, a bake sale or as a treat for yourself! Enjoy!

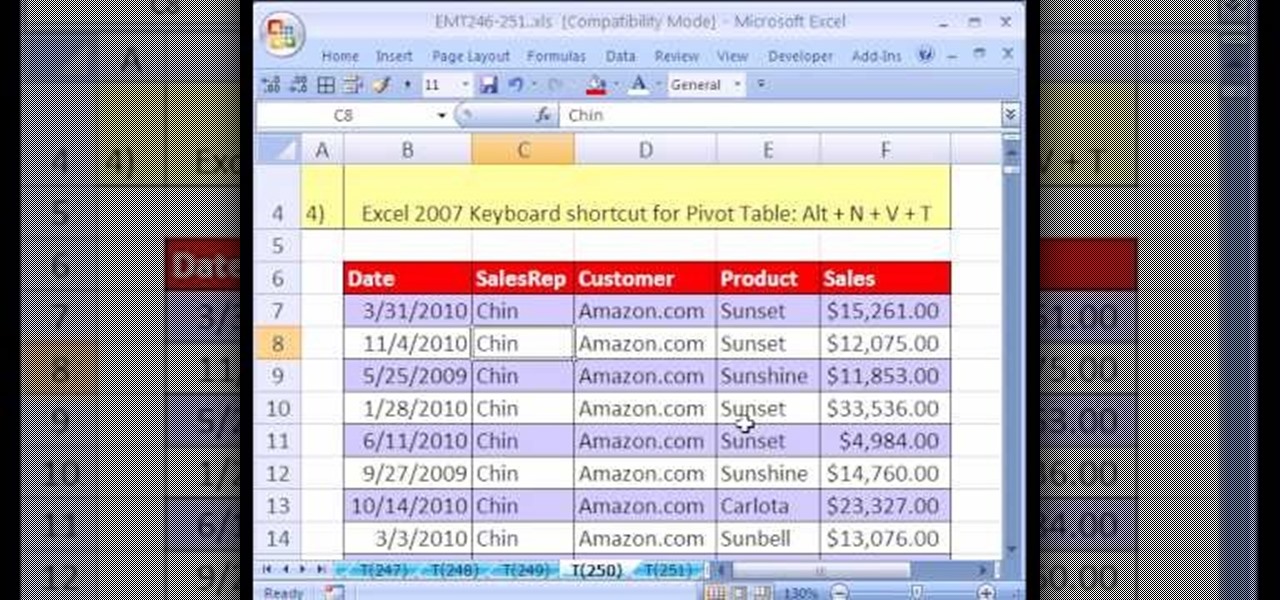
New to Microsoft Excel? Looking for a tip? How about a tip so mind-blowingly useful as to qualify as a magic trick? You're in luck. In this MS Excel tutorial from ExcelIsFun, the 250th installment in their series of digital spreadsheet magic tricks, you'll learn how to create a unique list of customers within a unique list of sales representatives using a pivot table (PivotTable).

Watch this science video tutorial from Nurd Rage on how to find chemicals for science experiments with Dr. Lithium.

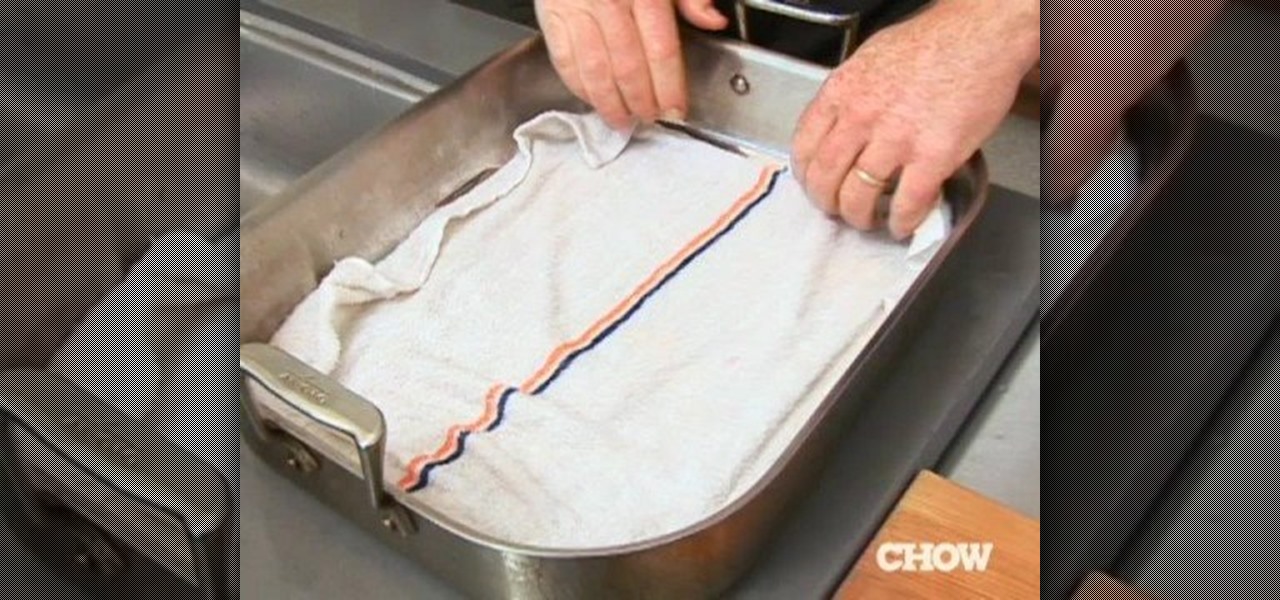
You bought a whole bunch of strawberries on sale, but you don't want them to go bad. CHOW contributor Daniel Duane shares his trick for keeping farmers’ market strawberries fresh and making them last longer. Just follow this cooking how to video for great tips on keep fresh fruit longer.

Some people get confused about a couple of aspects to solving the Rubik's Cube. Hopefully this video will clear things up. If not, then just don't watch anymore videos. Just put the cube in your closet, or in your yard sale, or smash it against the wall. Just give up.

In this episode shows you how to use the modal words such as should, might, and would; as well as learn words used in market reports and sales figures in the English language. This video is great for advanced, intermediate, and beginner learning to speak the English as a second language (ESL).

Bernard Smalls explains how to make big bucks in sales. If you hate what you are doing, you will not make big bucks. You have to remember that the point of sales to make money.


