Get the most out of every large bag of fertilizer you can find in FarmVille! First, harvest your crops that have already been fertilized. Then, replant the empty plots. Finally, spread the fertilizer across the growing plants on your farm!
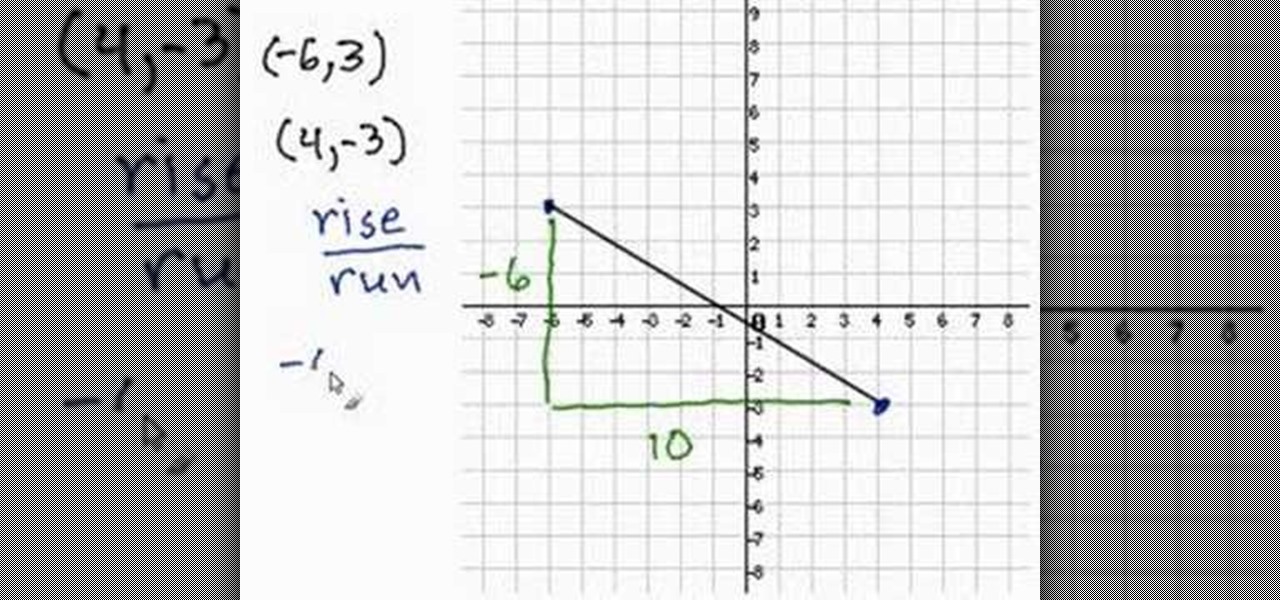
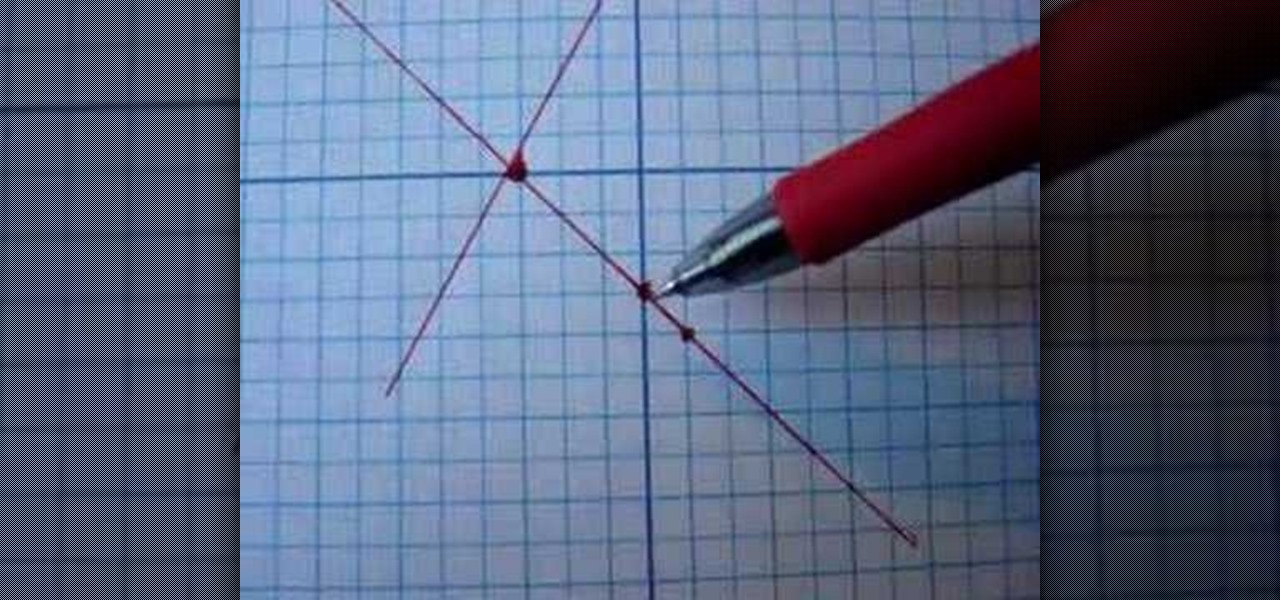
This tutorial will show you how to determine the slope of a line if you are given two coordinates on a coordinate plane. You should first find the location of each point on the plane, remembering that the coordinates are in the format of x-axis (or horizontal movement), followed by y-axis (vertical movement). After plotting both these points, you should draw a straight line between these two points and then determine the slope of this line by taking the rise over the run of the line.

Heidi Hewett demos AutoCAD 2009 and shows you how to use the Quick Access Toolbar. The Quick Acces Toolbar starts in the top right corner of the AutoCAD 2009 interface and contains the most common tools like new, open, save, plot, redo and undo. Learn how to use the quick access toolbar and how to customize the toolbar to include the tools you use most in AutoCAD 2009.

You want to have a tomato garden and you bought the seedlings already... now what? Watch this video tutorial to learn how to properly transplant your potted tomato seedling into your garden plot.

This video tells you how to draft an equation in point-slope form. Consider the equation (y+4) = 2(x+7) for example. The formula for the point-slope form is (y-y1) = m(x-x1). To plot the graph you have to identify m the slope, the x intercept x1 and the y intercept y1. In this equation the slope is 2 and (x1,y1). The x intercept according to the formula is -x1 but the given value is +7 so you have to figure out what will give you +7,only -(-7) can give you +7 so the point is -7 and now the y ...

If this is your first novel or you want to make a better one then this video will give you good advice on how to write fiction character for a great novel. The animated animals and people in this video will give you some great advice to improve your novel.

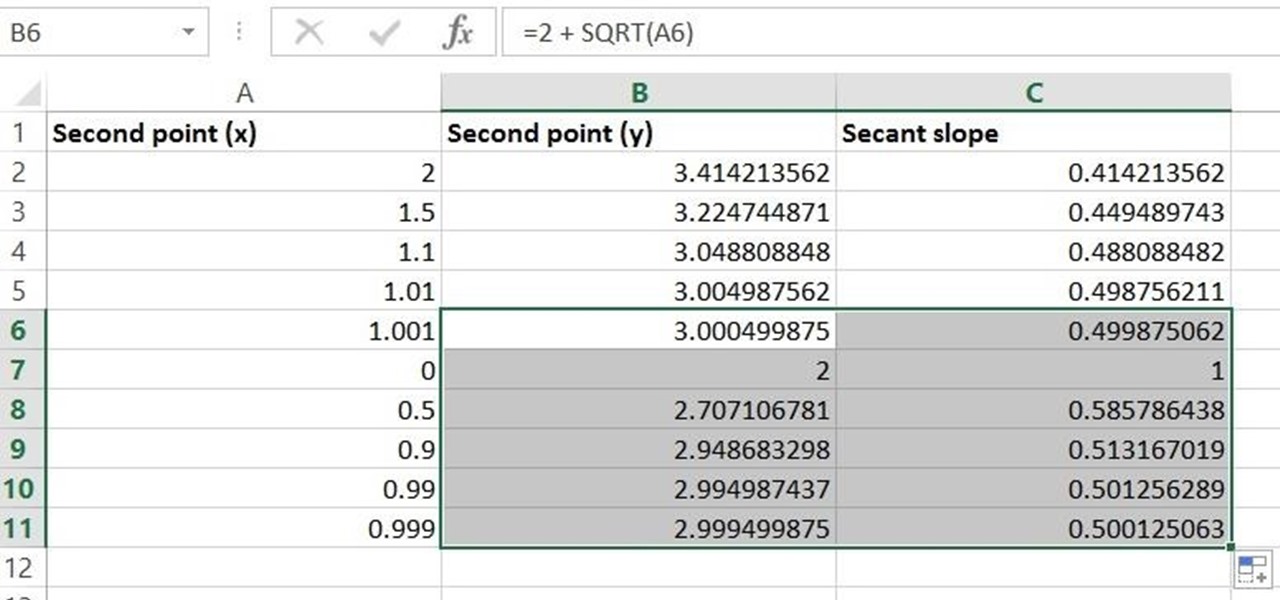
Given a function, you can easily find the slope of a tangent line using Microsoft Excel to do the dirty work. That is to say, you can input your x-value, create a couple of formulas, and have Excel calculate the secant value of the tangent slope. This is a fantastic tool for Stewart Calculus sections 2.1 and 2.2.
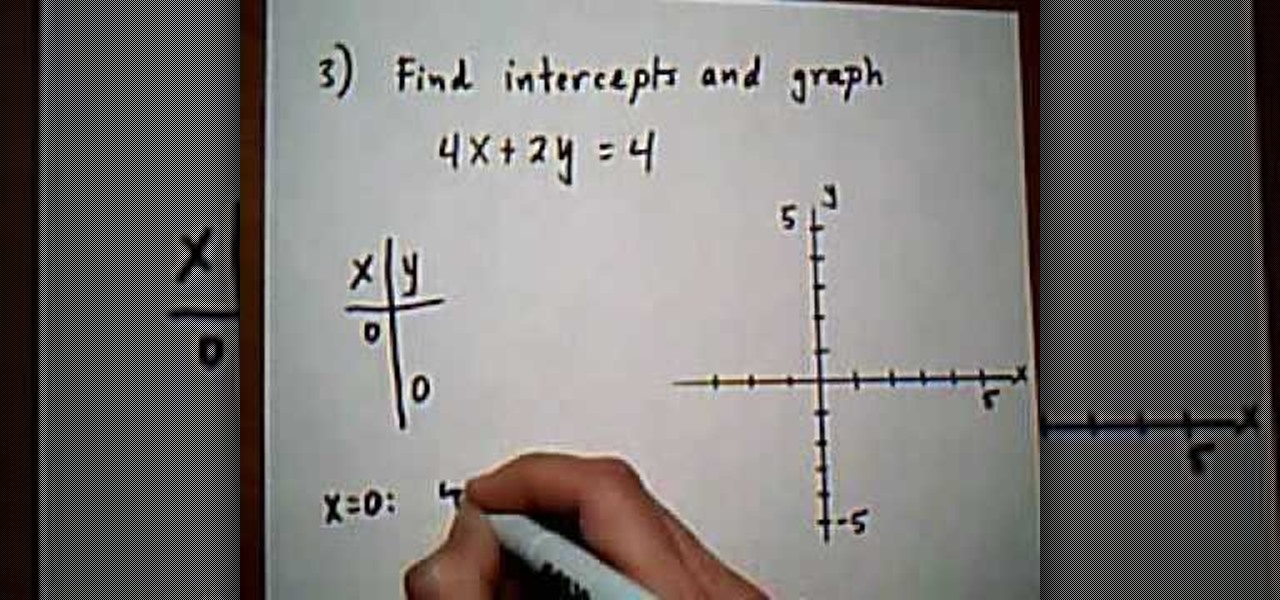
The first question asks for the intercepts x and y. To find X, you would need to set Y to zero, leaving the equation 3X=6. X then equals 2 after you divide both sides by 3. The X intercept that you found is not just the value of 2, but it is the ordered pair X=2 and Y=0 on a graph. To find Y, you would do the same thing, except this time X would be set to 0. In the second example of this video tutorial, you will actually learn how to graph the X and Y intercepts. To do that, you follow the st...
Turning over your soil mixes the nutrients and makes the ground more suitable for planting. Watch this video to learn how to turn over soil.
This video teaches how to plow without rows in Facebook's Flash game Farm Town. It is easiest to start at the top corner of your farm. Notice, put your cursor on the green highlight (or JUST below) of the plot. Then click left mouse button hold down and BARELY drag up and toward the plot to the left. It is tricky at first but after a field or two it is easy. This will DOUBLE the amount of crops you can plant on your farm.
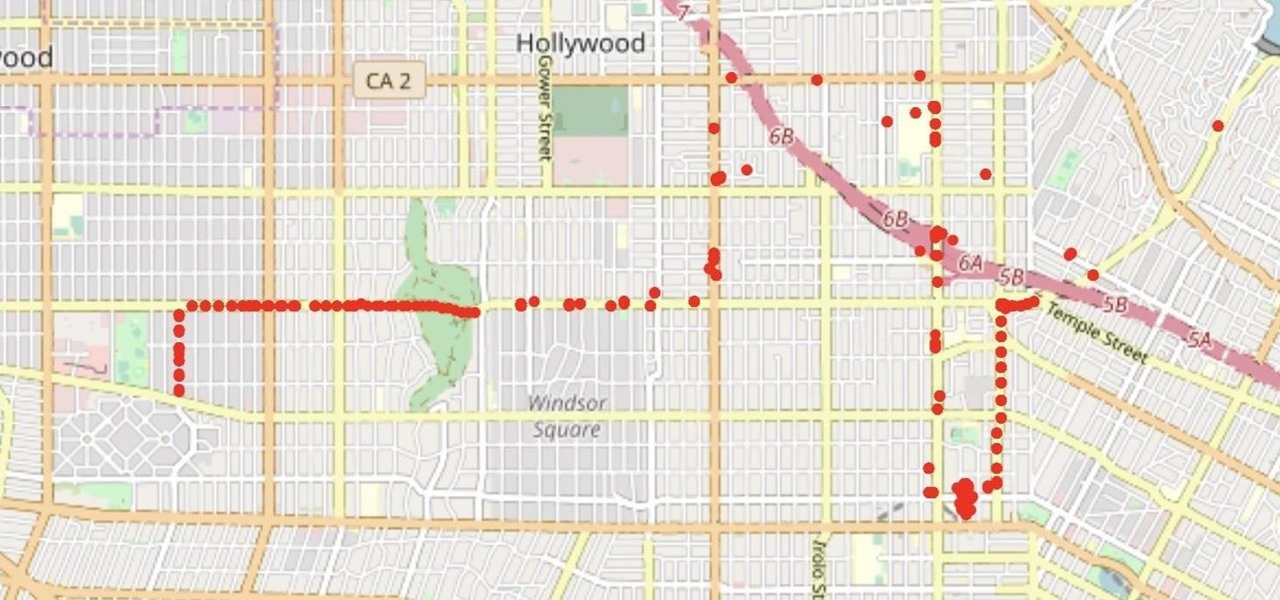
With the Wigle WiFi app running on an Android phone, a hacker can discover and map any nearby network, including those created by printers and other insecure devices. The default tools to analyze the resulting data can fall short of what a hacker needs, but by importing wardriving data into Jupyter Notebook, we can map all Wi-Fi devices we encounter and slice through the data with ease.
We're addicted to "True Blood." And, if we're going to be honest here, it's not just because the show has labyrinthine plot lines and exciting vampire vs. human vs. werewolf action. With hot chicks and hot guys, the show seems to be a breeding ground of good looks. And we're not complaining.
New to Microsoft Excel? Looking for a tip? How about a tip so mind-blowingly useful as to qualify as a magic trick? You're in luck. In this MS Excel tutorial from ExcelIsFun, the 351st installment in their series of digital spreadsheet magic tricks, you'll learn how to create an area chart for x and f(x) data as well as how to use the IF function to show a second data set plotted to show a specific area section.
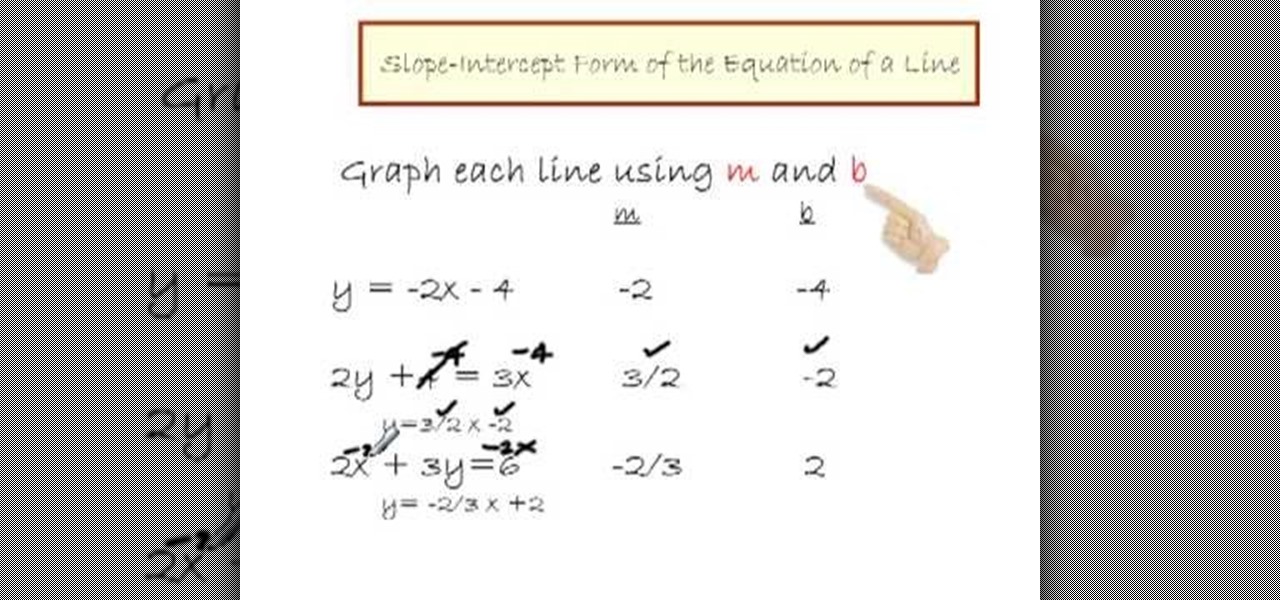
A basis of algebra, slope intercept form can easily bring your equation to a graph with ease. This video will show you exactly how to graph equations using the slope intercept form.
Calculus can be a bit tricky, but don't worry, Watch Math is here to help you out. Watch this math video lesson to learn how to solve quadratic inequalities in calculus. There's no better way to learn mathematics than from an advanced mathematician, like this PhD.
The discriminate of any equation in any degree plays an important role in determining the roots of that equation.
Plangere Culture Lab demonstrates how to use the opacity feature in Final Cut Pro. The opacity feature is a beneficial tool to use when working with layers. Opacity is an attribute which relates to how much you can see through a clip. To layer clips, create a new video track on the timeline. Make sure that the source tab is in the right position. The track on the top of the stack is the dominant track and will be shown. Select the volume and opacity overlay button. Click on the line over the ...
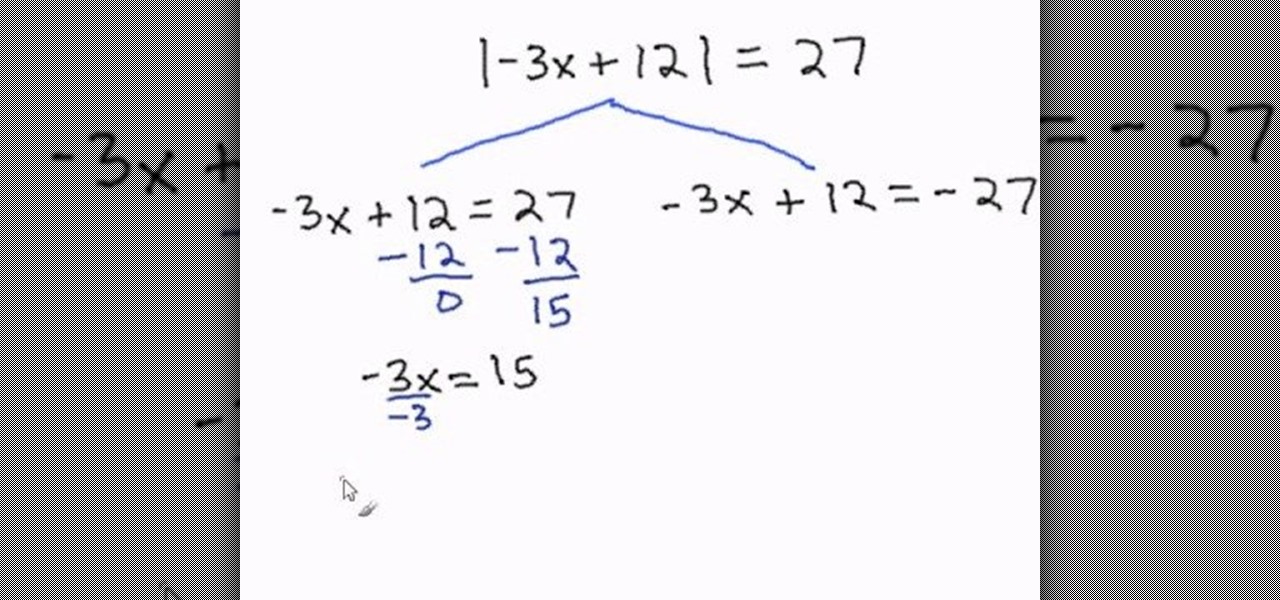
This educational math video describes the steps necessary to solve an equation involving absolute values. "Absolute value" refers to the magnitude of a quantity and is always expressed as a positive number. You can think of absolute value as the distance a number would be from zero if plotted on a number line. Positive 17 and negative 17 both have the same absolute value because both are 17 units from zero on a number line. Because of this, all absolute value problems have two answers, one wh...
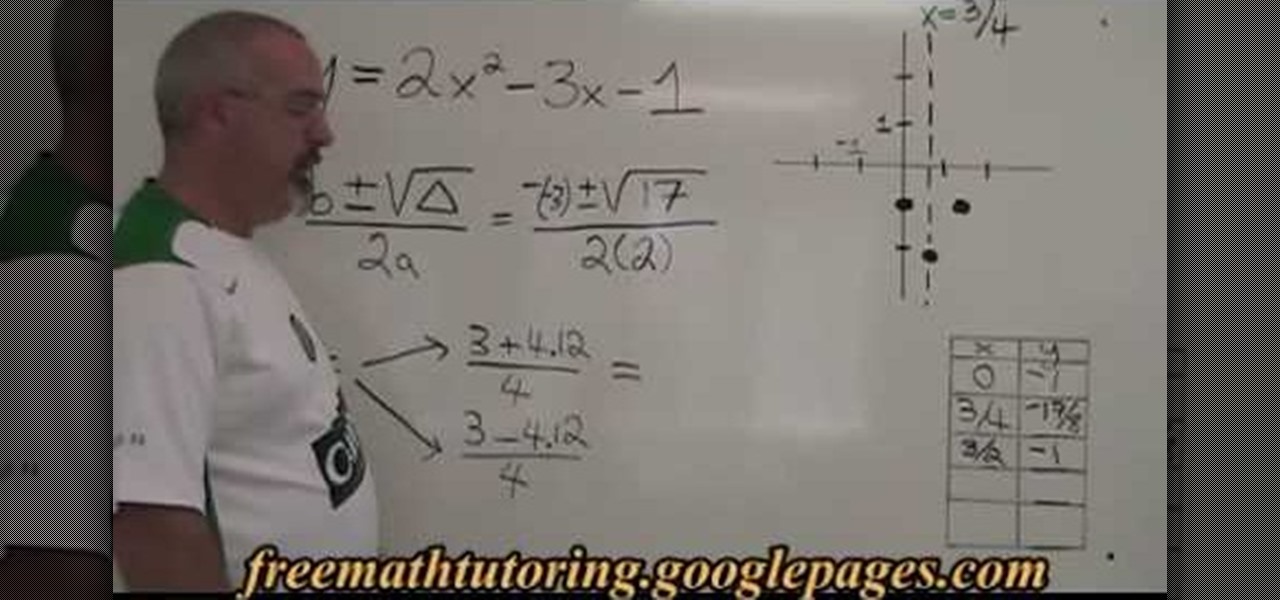
In this tutorial the instructor shows how to graph a parabola and also how to find its roots which are also known as zeroes. He gives the quadratic formula of how to find x-intercepts of a parabola. He takes an example and substitutes the values and finds out the values of the roots of the parabola. Now he substitutes these values in the equation to obtain the corresponding y coordinates. Now using these pairs of values he plots the parabola on a graph and draws it. This video shows how to fi...
This is an interesting mathematical instructional video on how to make a quartile diagram. This example is about 34 grades obtained by chemistry class students. We need a minimum value, a maximum value, Q1, Q2 and Q3 values to make a quartile diagram. The minimum is 43 and the maximum is 92. To calculate Q2 median formula (n+1 over 2)is used. The Q2 median is 17.5. So the average of 69 and 71 is 70 and hence Q2 70. Similarly Q1 is calculated as 61 and Q3 is calculated as 79. Now you can draw ...
Written and illustrated by Masashi Kishimoto, "Naturo" is an ongoing Japanese manga series. The plot tells the story of a young ninja named Naruto Uzumaki, who constantly searches for recognition & aspires to become the ninja in his village that is acknowledged as the leader and the strongest of all, also called a Hokage. The series is based on a one-shot comic by Kishimoto that was published in the August 1997 issue of Akamaru Jump and has since grown into a phenonmenon.
Mike Lively of Northern Kentucky University demonstrates how to create a 3D plotting program for the sinc math function. Part 1 shows how to convert a Flash Package into a Flex application. Part 2 shows how to get the sinc function running and add different textures. Create a cool interactive 3D plotter in thie Adobe Flex Builder 3 and Papervision3D tutorial.
What makes a good movie good is that it is both aesthetically pleasing and has an interesting point/plot. This video runs you through how to make it visually effective, stressing how you frame and compose a shot. While the Rule of Thirds is forever a great way to make shots interesting, there are other ways you can set up a shot.
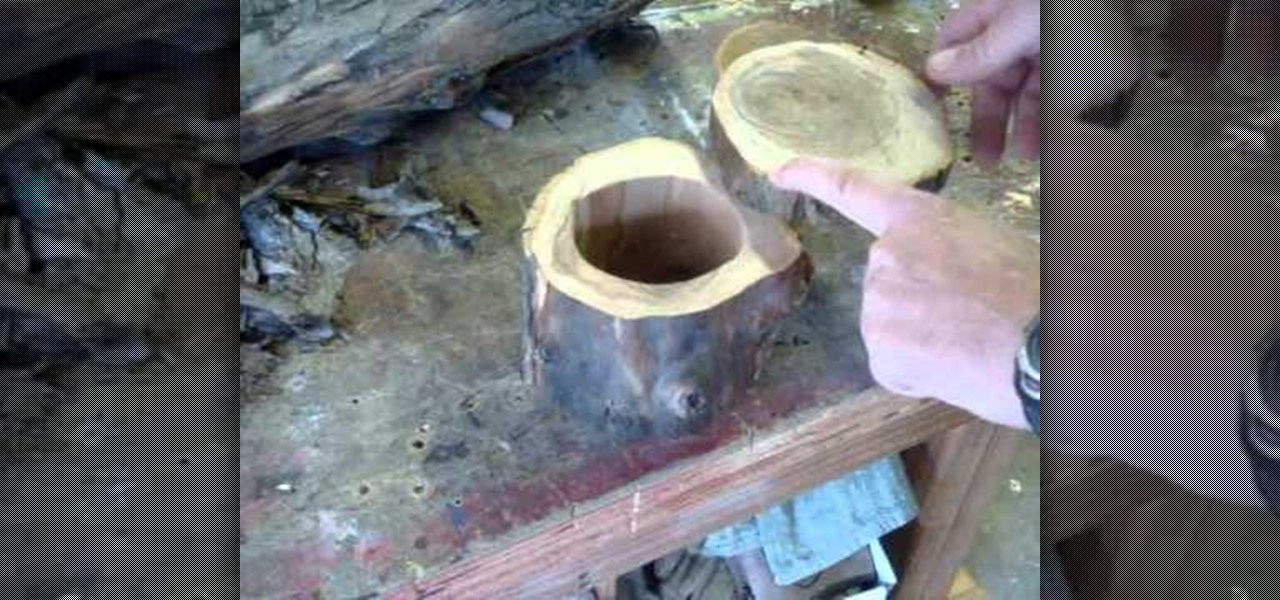
If you're lucky enough to have a large backyard, or perhaps even a plot of land, then you probably have several trees on hand. If for whatever reason one or two of these trees needs to be cut down, don't just dispose of the wood!
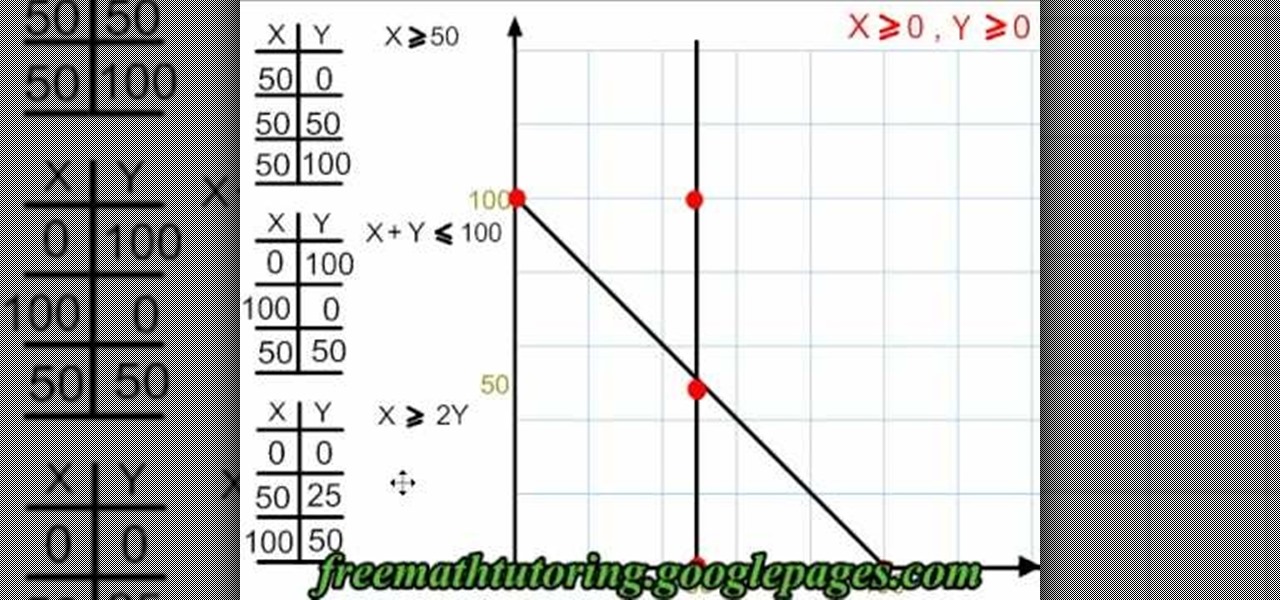
This video shows us how to graph & shade a polygon of constraints. Start out by finding the non zero constraints and the other constraints and inequalities. You will need to know how to graph before you begin to do this equation. Look at the first constraint and then fill in the X and Y sign in your table. Continue on to do this for the other two constraints that you have. Once you have these written down and in front of you, it's just a matter of graphing. Start to graph with the given coord...
In this tutorial, we learn how to find the area of a triangle given three points. First, you will need to plot the points on a graph. After this, find the base and the height using the graph. Next substitute into area of a triangle formula and then evaluate. When you finally find the area of the triangle, then you will write down the answer ending it with the units. This is a simple way to find the area of the triangle, you just have to make sure you count correctly and have calculated the ar...
Great! You've finished your masterpiece of a module ready for play in Dragon Age! You've got quests and characters and plot twists and all sorts of other good stuff! But...how do you play it? If you're not sure what to do, check out this video. In this video you will learn how to export a basic module into the main game so you can play it, or share it with other users!
Spidey finally finds the location of where Scorpion was planning on taking his fragment, a high tech building in the city. And to his surprise, he finally finds the mastermind behind the whole plot: Doctor Octopus, or Doc Ock, or Sa- oh who cares what her real name is? She's gone mad with delusions of power thanks to her discoveries with the shard and she's planning to the take over the world (craaaaaaazzzzyyyyyyy). In this video you will get a full walkthrough for chapter 11 of Spider-Man: S...
Solving the Inequalities using graph, first you have to take the inequality equation into equal. Then convert the equation into straight line equation i-e(y=mx+c). Giving own values for 'x' like (-1, 0, 1) we would get the value for 'y'. By plotting these points in the graph, you will get an straight line. If the given equation is greater than symbol, shade towards the positive part. If the given equation is smaller than symbol, shade towards the negative part. This is an one method to solvin...
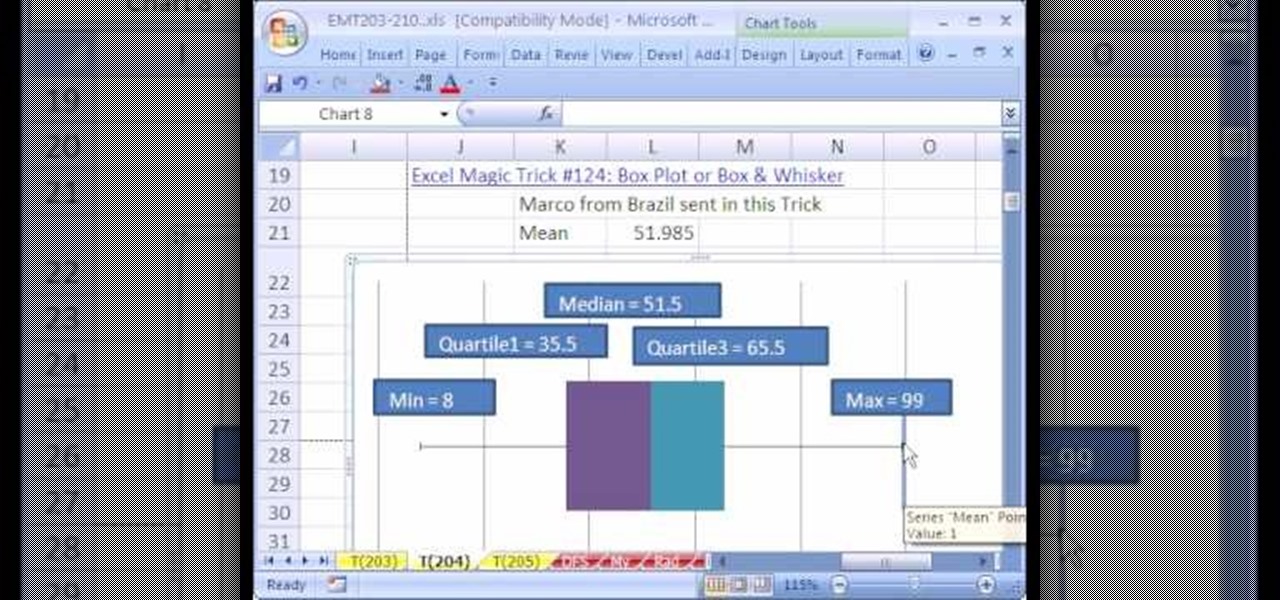
New to Microsoft Excel? Looking for a tip? How about a tip so mind-blowingly useful as to qualify as a magic trick? You're in luck. In this MS Excel tutorial from ExcelIsFun, the 204th installment in their series of digital spreadsheet magic tricks, you'll learn how to add a mean value as a scatter diagram data series to a box plot or box & whisker that is set up as a bar chart.
This video shows the viewer how to solve simultaneous equations using a graph or ‘graphing’ as it is referred to. This is done by first rearranging both equations so that y is the object of both equations. The equations can then be solved via substitution – the video does not cover this. Using graphing the next step is to plot both of the lines onto the graph. This can be done by substituting varying values of x to give the y co-ordinates. The solution to the linear equation should be the poi...
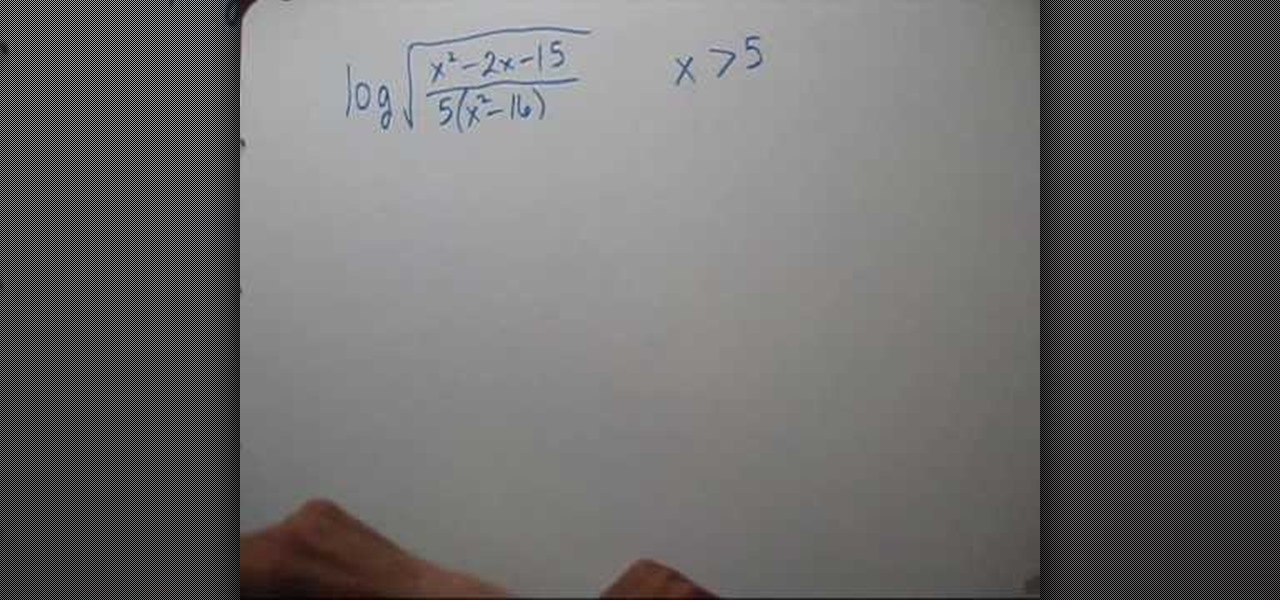
This video shows the method to write a logarithm as a sum or difference of logarithms. The square root of the term given is taken out as half according to the rule. Then the numerator and denominator is divided into product of factors. This is broken into the difference of numerator and denominator according to the rule. Finally, the product of factors is expressed as the sum of factors. Now we see the domain of the term. As the term is a square root of the term it should be greater than zero...
In this video tutorial, viewers learn how to graph a linear equation. The linear equations example used in this video is y= 1/3x-3. The equation to graph a linear equation is y= mx+b. Now substitute each number into the equation. Therefore, m= 1/3 and b= -3. Begin by graphing the Y-intercept. M is the slope and b is the y-intercept. Plot the y-intercept on the -3 axis. Then move up once and to the side 3 times. This video will benefit those viewers who are struggling with this math unit and a...
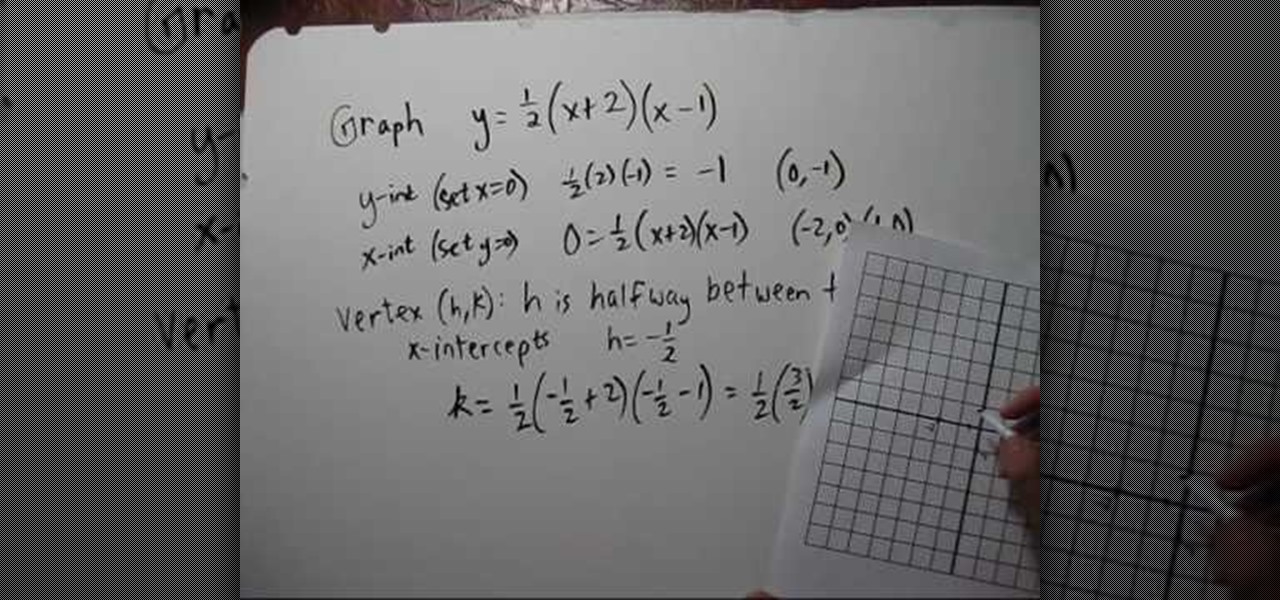
This video deals with solving quadratic functions. It does not involve the use of the quadratic equation; rather, only factored equations are used. The speaker starts out with a factored quadratic equation. The speaker goes on to do the mathematical steps necessary to find both the x and y intercepts of the quadratic function at hand. The author then continues on with the example to find the function's minimum. Next all of the points that have been solved for are plotted and the function is s...
This video shows the method to graph a linear function by finding the X and Y intercept. Only two points are needed to graph linear functions. So we find the point on Y axis or the Y intercept and the point on the X axis or the X intercept. We notice that on the Y axis the X coordinate is zero. So, we find the Y intercept by putting x=0 in the given equation and solving for y. In the same way, we find the X intercept by putting y=0 in the given equation and solve for x. We join the two points...
Without good navigational skills, your expedition could lead to failure or result in a dangerous situation. Try to use a laminated map which is better in wet conditions. 1:25,000 scale maps provide the greatest detail. One grid square equals 1 kilometer. Use map keys for reference. Don't mistake boundary walls for footpaths. A compass points to magnetic north and the top of the planet is called true north. Magnetic north is constantly moving and its position relative to true north is differen...
This video shows us how to draw a linear equation using the slope and intercept technique. First, the narrator explains how to simplify the equation in order to get the slope and intercept out. He then shows how the coefficient of x equals the slope and the constant term tells us the y position of the intercept point. The technique for drawing the final line is plotting the intercept at the right height on the y axis, then running for some distance along the x axis and rising some amount. Thi...
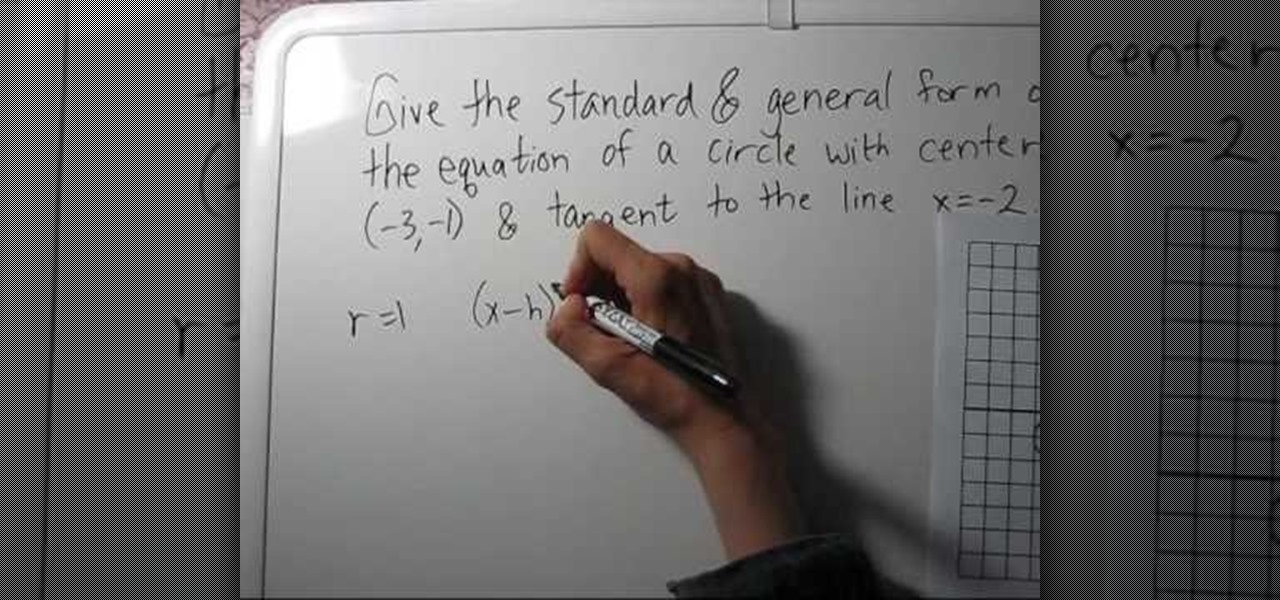
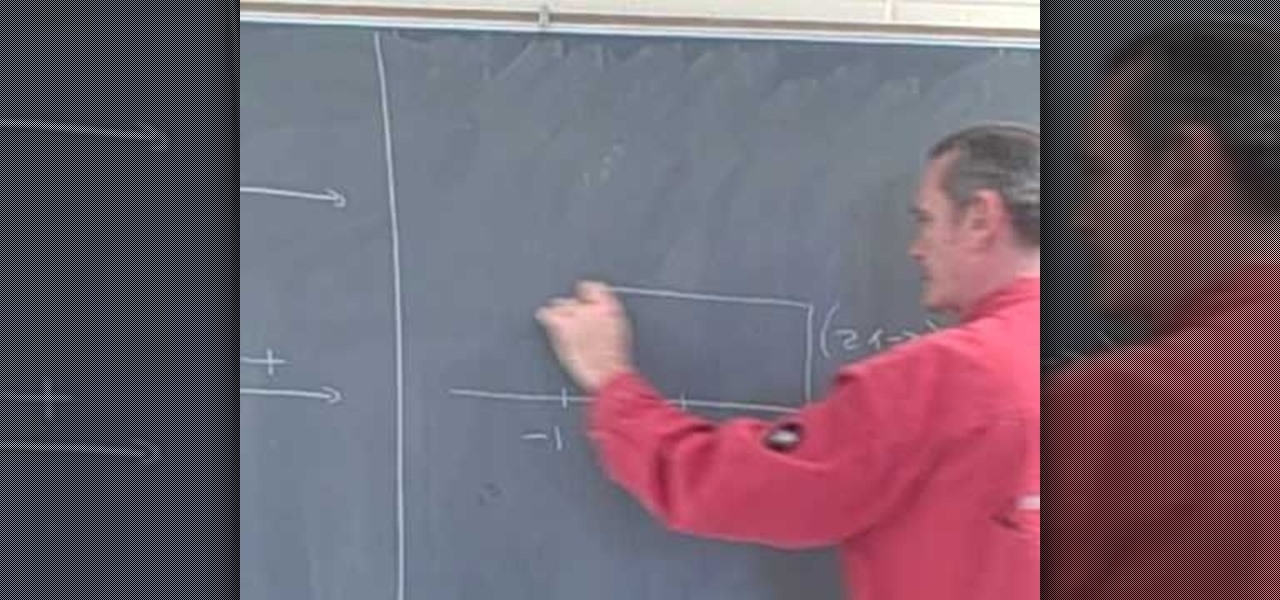
In this video, the instructor shows how to find the equation of a circle given its center point and a tangent line to it. To do this, take a graph and plot the given point and the tangent on that graph. Now, from the center of the circle, measure the perpendicular distance to the tangent line. This gives us the radius of the circle. Using the center point and the radius, you can find the equation of the circle using the general circle formula (x-h)*(x-h) + (y-k)*(y-k) = r*r, where (h,k) is th...
When you are solving inequality for a rational function you don't do it the same way as you would solve an equality. Now the instructor shows how to solve an inequality with the help of an example. Now to solve an inequality which is in the form a/b first take the numerator and denominator as separate equations of two lines. Now graph the two lines on coordinate axes. Using the graphs of the lines plot the intercepts of the equations on the number line noting down the sings. Now you can compa...
This video shows you how to graph an equation in standard form. In easy to understand instructions, you will learn how to find the x and y intercepts in order to put those two points on a graph, creating a line. Finding the intercepts is as easy as plugging in zero and solving for either x or y. This creates an ordered pair, which can then be graphed. The points are plotted easily on a Cartesian plane, which completes the problem.