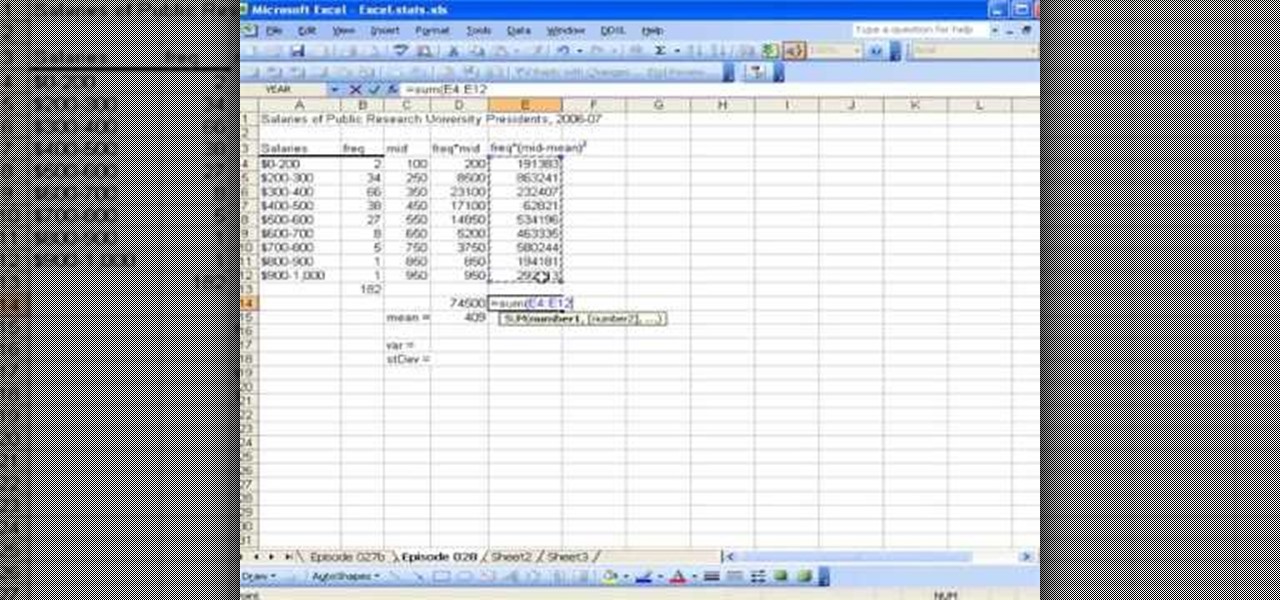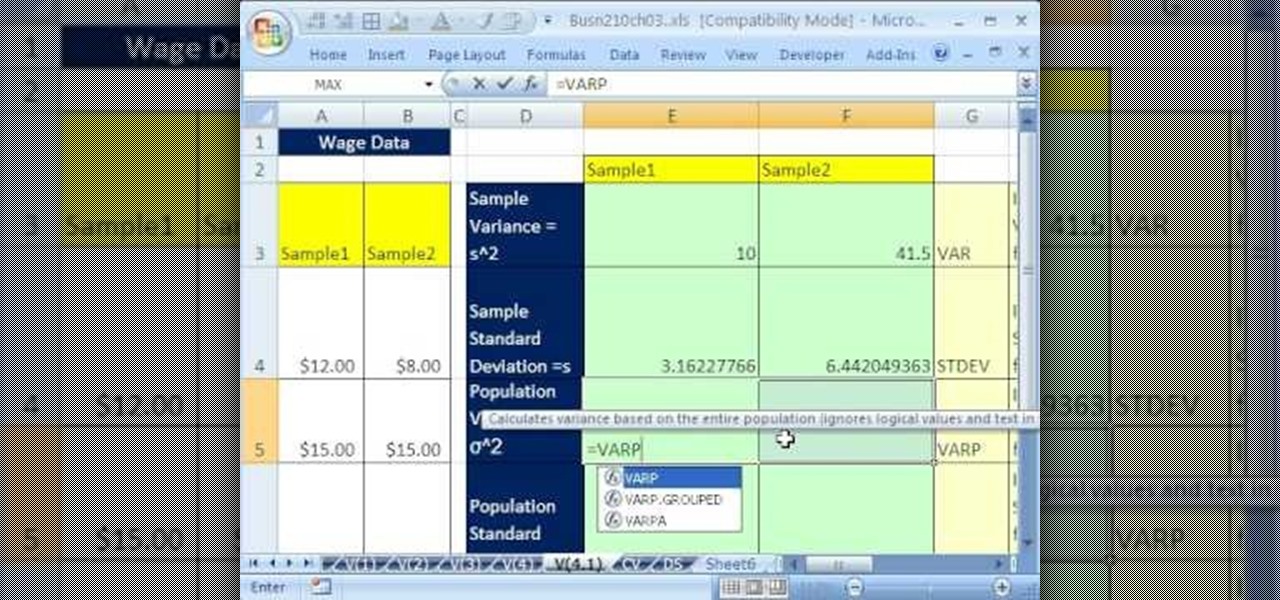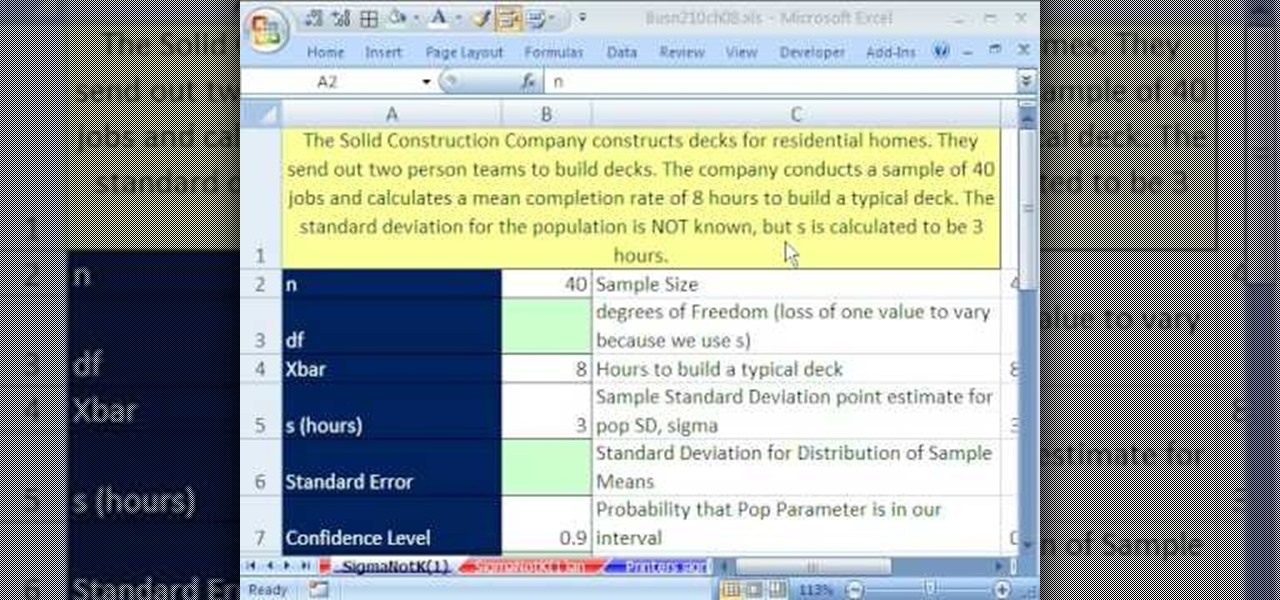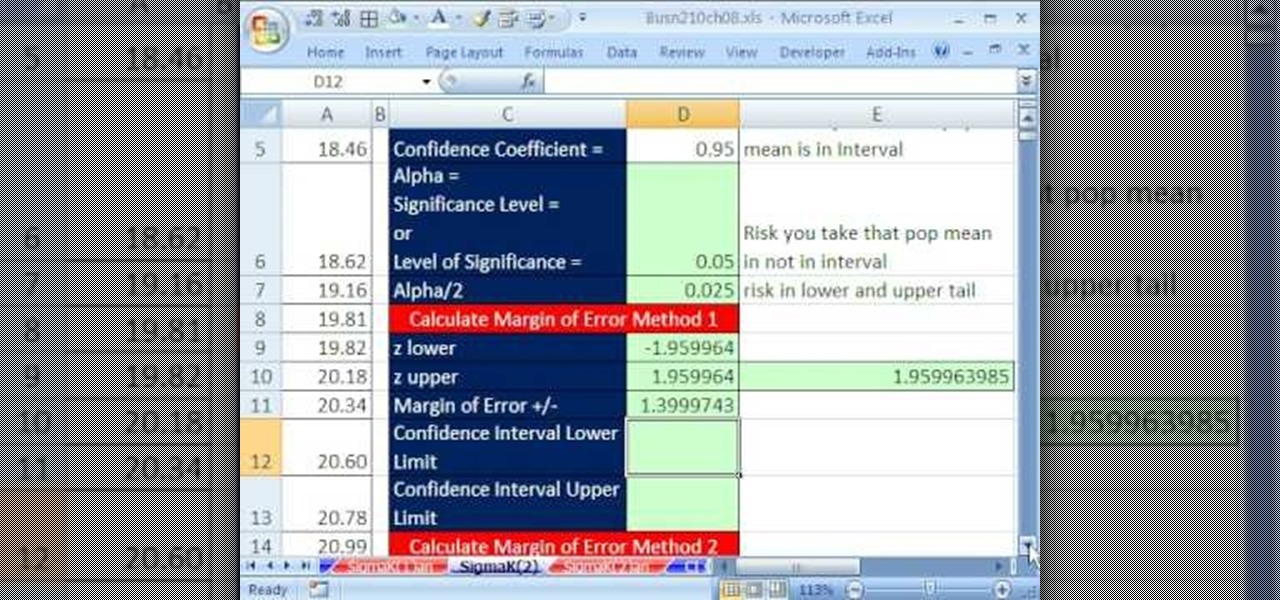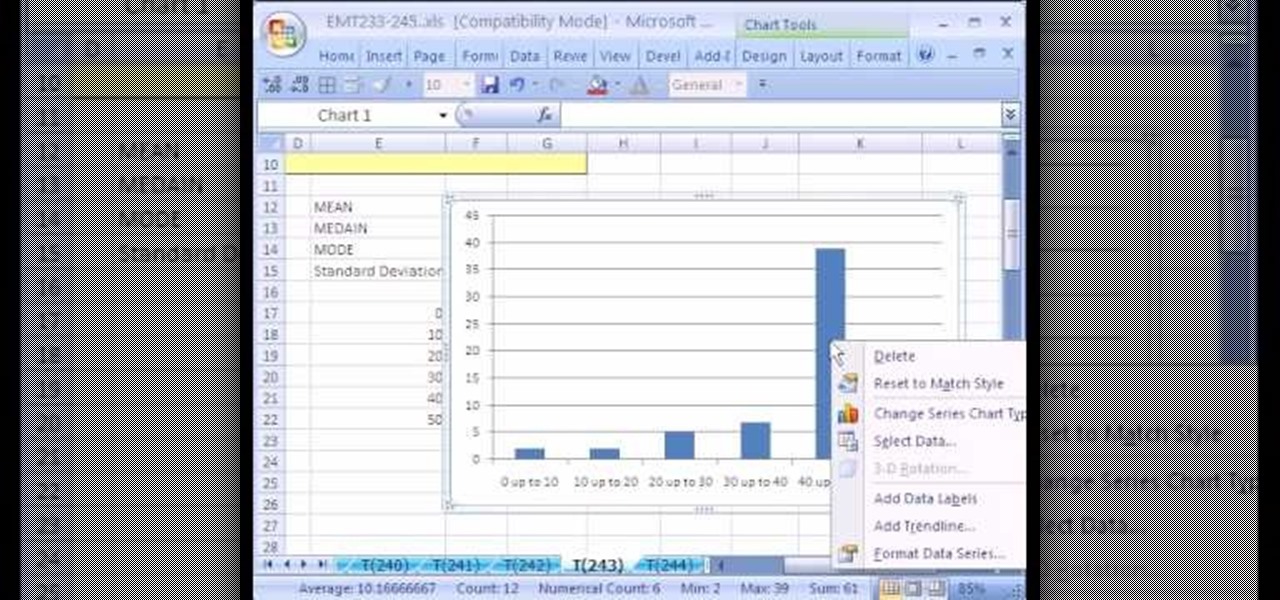
New to Excel? Looking for a tip? How about a tip so mind-blowingly advanced as to qualify as a magic trick? You're in luck. In this Excel tutorial from ExcelIsFun, the 243rd installment in their series of digital spreadsheet magic tricks, you'll learn how to find typical values, or averages – a single value that allows you to talk about all the data points in a given spreadsheet. Specifically, you'll learn how to find the mean, median, mode and standard deviation for a set of numbers.
Looking to find the standard deviation of your set of values? Standard deviation quantifies how diverse the values of your data set are, and is useful in determining how different your numbers are from each other.

Mean and standard (or normal) deviation may be hard to understand at first, but with the help of this handy little guide from the pros at Exam Solutions you will be up to speed in no time.

In this tutorial, we learn how to know what standard deviation is in your portfolio. Standard deviation is the amount of risk you have inside your portfolio, this will show you how much fluctuation you have in your portfolio. Depending on the expected return of your portfolio over an amount of time, you could have a different range of standard deviation. Knowing what your standard deviation can help you do the math to see what your chances of a return or loss will be for certain. This will he...
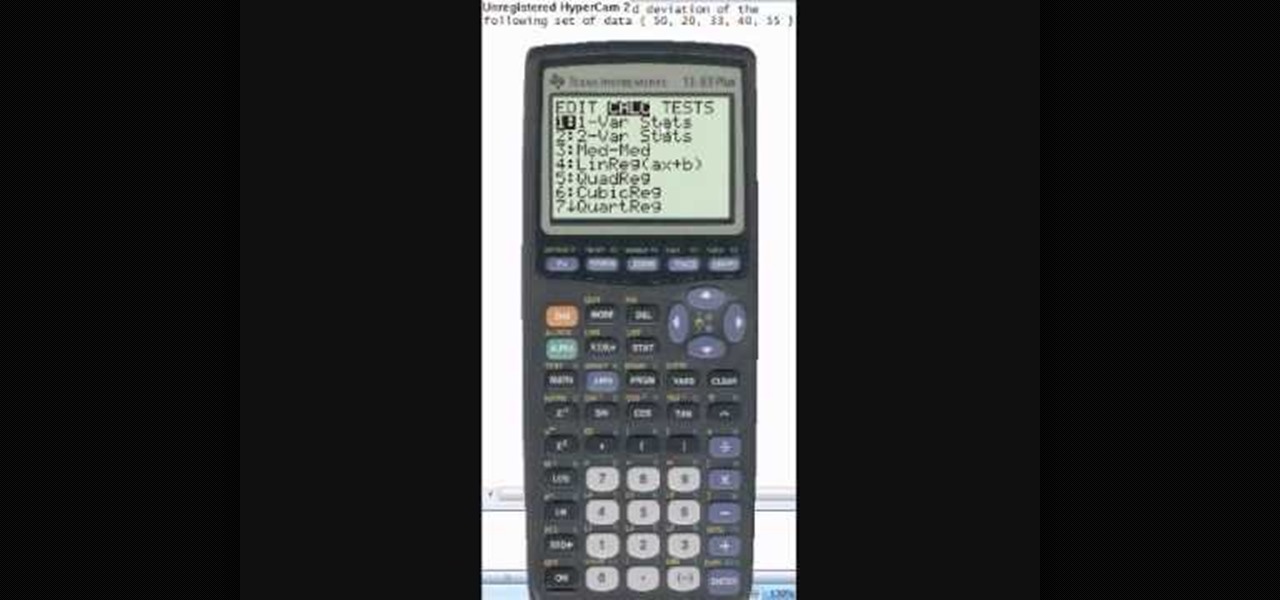
This video tutorial is in the Education category which will show you how to calculate standard deviation with TI graphing calculator. First you got to enter the data in to the calculator. Go to stat and click on enter. This will edit a list. Now you type in these numbers: 50, 20, 33, 40 and 55. Then press stat and click on enter. This will bring up the 1-var stats page. Press the "2nd" button and L1, because all our data is in L1. Click on enter and you will get all the data that you will nee...

In this tutorial, we learn how to find the standard deviation with the Z-Score formula. First, take your problem and write it out one by one underneath each other. Then, you will need to substitute the numbers in for the variables that are in the problem. Once you do this, you will follow the basic rules of math to find out what the answer to the problem is appropriately. Once you have done this, finish off the problem to find the answer, then you will have found the standard deviation using ...

This video shows the method to find the variance and standard deviation using Excel. The variance shows the variability of the data points from the median. We find the difference of the median and the mean. We write the formula using '=' sign. The median and data points are put in it by selecting the appropriate cell. The median is made an absolute constant by pressing the F4 key. This is squared by using '^2'. This is multiplied to the frequency using '*'. The result is found for all the dat...

Keith M. Bower explains the meaning of mean and standard deviation. This educational video gives insight in the basics of statistics. The relations between population mean and sample mean and between population standard deviation and sample standard deviation are explained. The mean gives an idea on the central tendency. Standard deviation gives an idea about how spread out the data are. Keith also explains how these two parameters, the joint sufficient statistics, define a normal distributio...

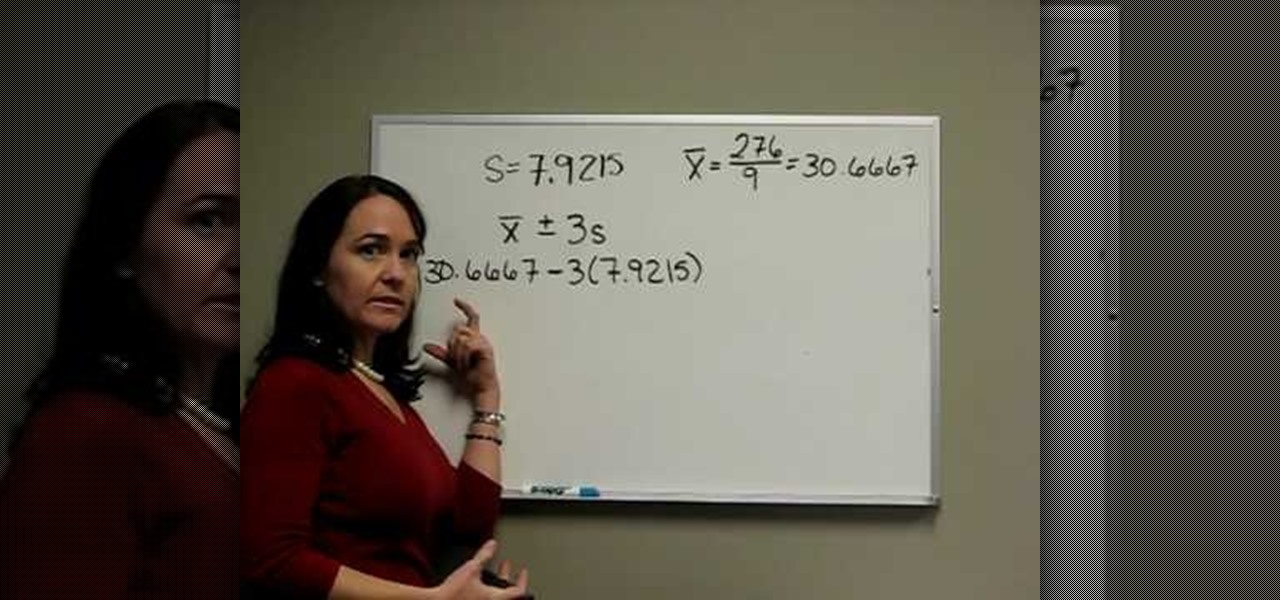
A rough definition of standard deviation is that it is a measure of expressing the observed variations about the average in statistical data i.e. by how much do the observed values vary from the mean. This video continues from the previous solved example and demonstrates the mathematical interpretation of the standard deviation that was calculated. We begin with stating the mean and standard deviation values and then calculating the upper and lower bounds of the data based on the standard dev...

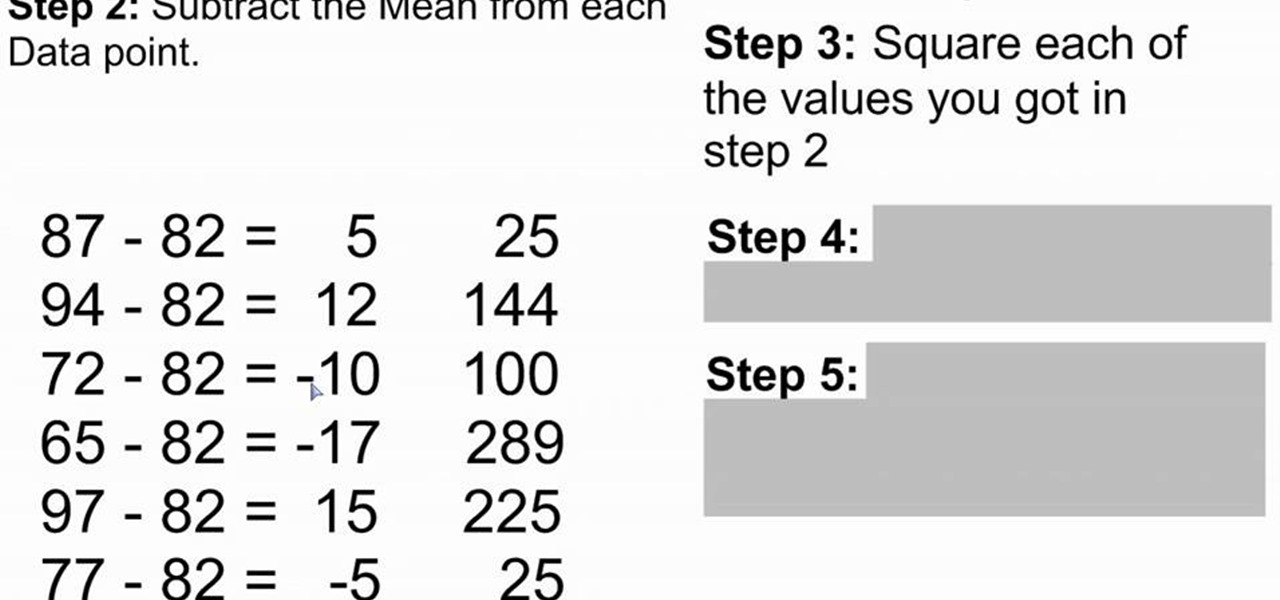
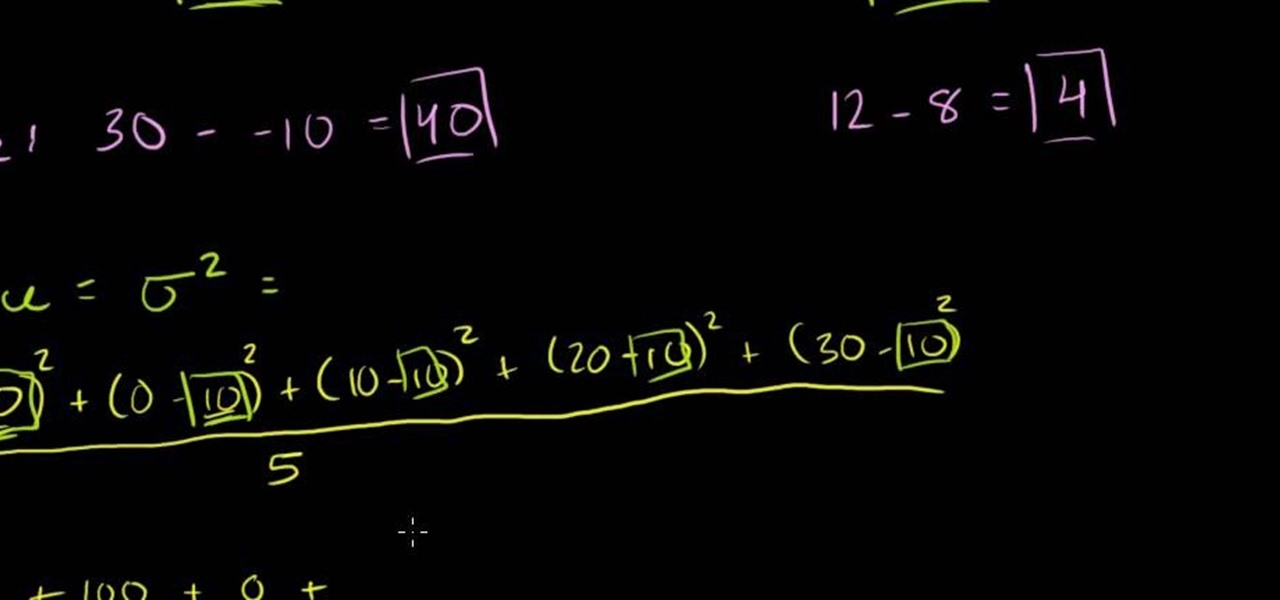
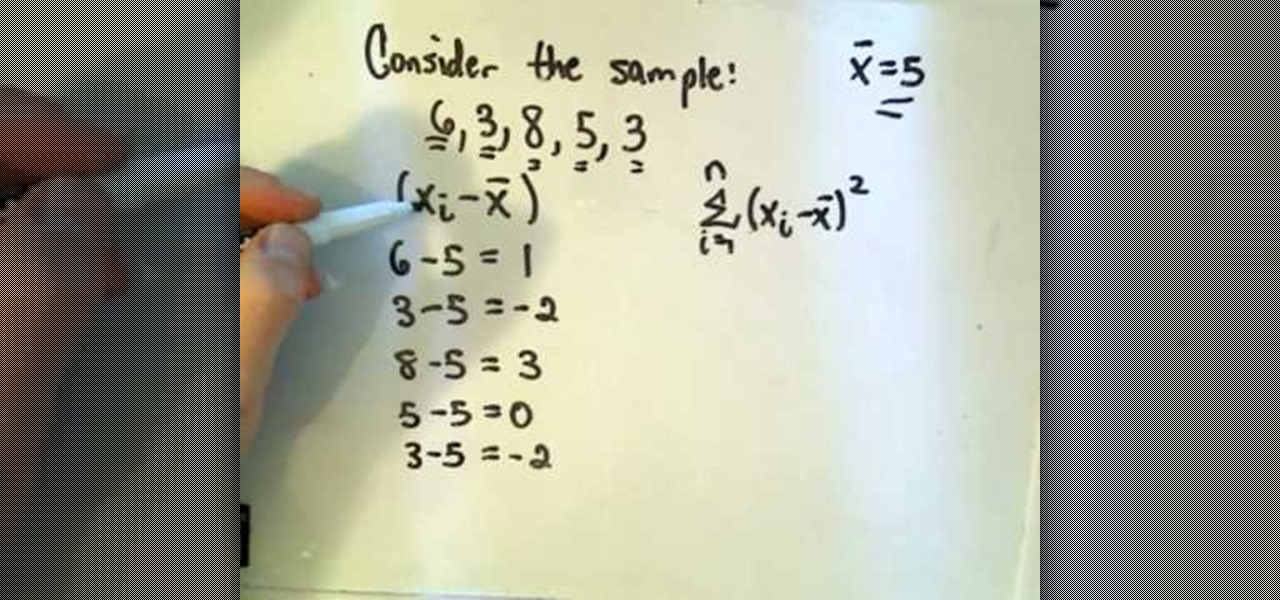
In this video tutorial, viewers learn how to calculate the standard deviation of a data set. The standard deviation of a statistical population, a data set, or a probability distribution is the square root of its variance. To calculate the standard deviation, users will need to follow these steps. 1) Find the mean of the data. 2) Subtract the mean from each data point. 3) Square each of the values you got in step 2. 4) Then find the mean of the values you get from step 3. 5) Finally, square r...

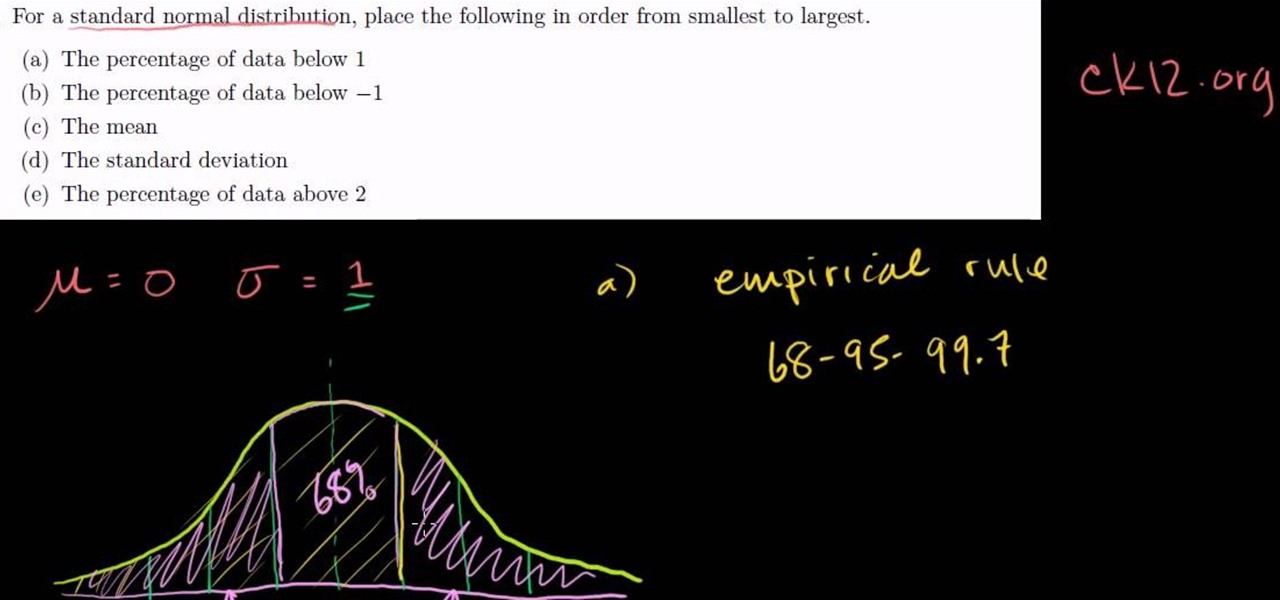
In this video tutorial the instructor explains about the concepts of standard normal distribution and the empirical rule and how to use it to solve an exercise. He starts by explaining about standard normal deviation saying that in a standard normal deviation the value of mean is zero and the value of standard deviation is one. Now he draws the standard normal deviation by drawing a bell curve on an axis. Now he points the mean and standard deviations on it. Now using these concepts he goes o...

If you use Microsoft Excel on a regular basis, odds are you work with numbers. Put those numbers to work. Statistical analysis allows you to find patterns, trends and probabilities within your data. In this MS Excel tutorial from everyone's favorite Excel guru, YouTube's ExcelsFun, the 41st installment in his "Excel Statistics" series of free video lessons, you'll learn how to calculate deviations, variance and standard deviation for a sample and a population using Excel tables and the VAR, S...

This is a video tutorial in the Education category where you are going to learn how to compare 2 distributions with the Z-Score formula. In this example Doug's class has X bar as 71 and a standard deviation of 4. Corey's class has X bar as 68 and a standard deviation of 11. If both Doug and Corey beat the class average and have the same standard score, will Doug have a lower grade than Corey? If both of them have a standard score of 1.5, then Doug will get 77 marks and Corey will get 84.5 mar...

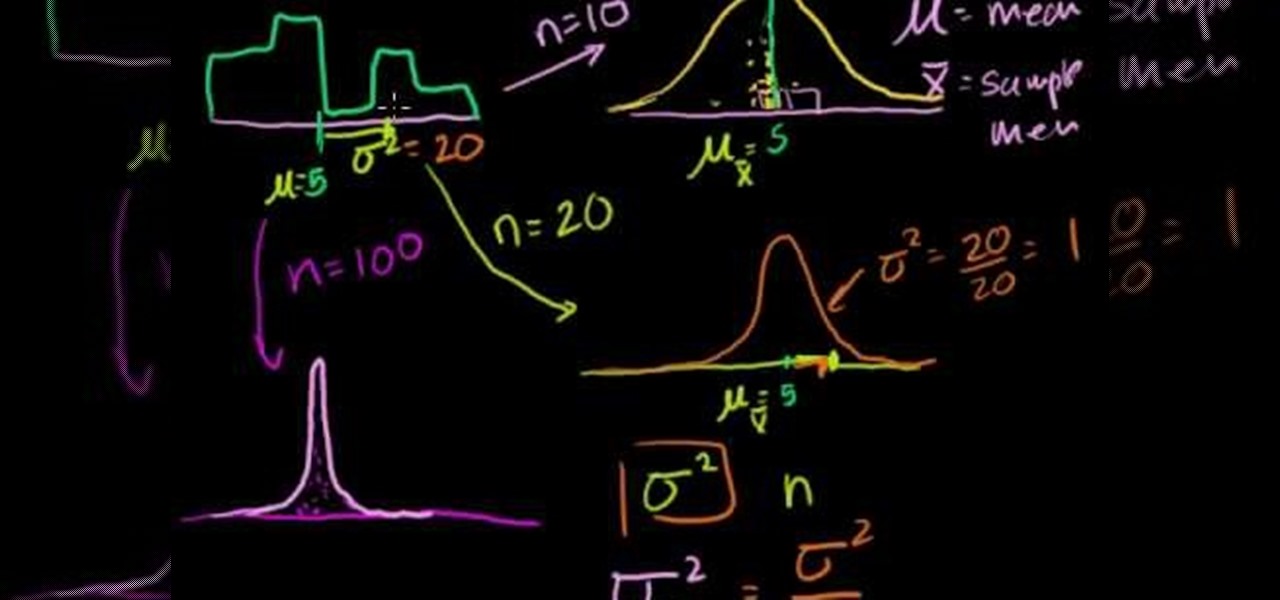
In this video the tutor explains about the standard error of the mean. He starts explaining by drawing the diagram of a distribution and now he takes ten samples from the distribution and starts plotting them. He says that in theory if we do it infinite times then we can obtain the sampling distribution of the sampling mean. For the example he takes the number of samples as 10. Now depending on these values of n we can get different sampling distributions. Now he intends to find the mean of t...

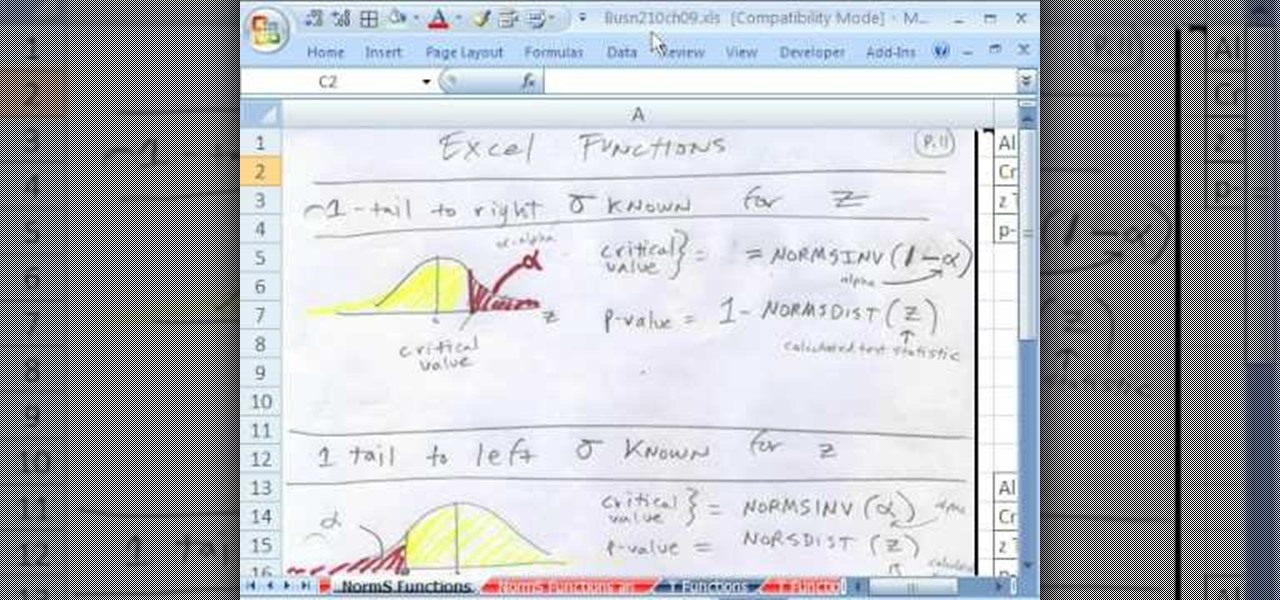
If you use Microsoft Excel on a regular basis, odds are you work with numbers. Put those numbers to work. Statistical analysis allows you to find patterns, trends and probabilities within your data. In this MS Excel tutorial from everyone's favorite Excel guru, YouTube's ExcelsFun, the 87th installment in his "Excel Statistics" series of free video lessons, you'll learn how to use NORMSINV to test a hypothesis with population standard deviation (sigma) known and proportions.

From Ramanujan to calculus co-creator Gottfried Leibniz, many of the world's best and brightest mathematical minds have belonged to autodidacts. And, thanks to the Internet, it's easier than ever to follow in their footsteps (or just study for that next big test). With this installment from Internet pedagogical superstar Salman Khan's series of free math tutorials, you'll learn how to use statistical range, variance and standard deviation to measure dispersion in a data set.

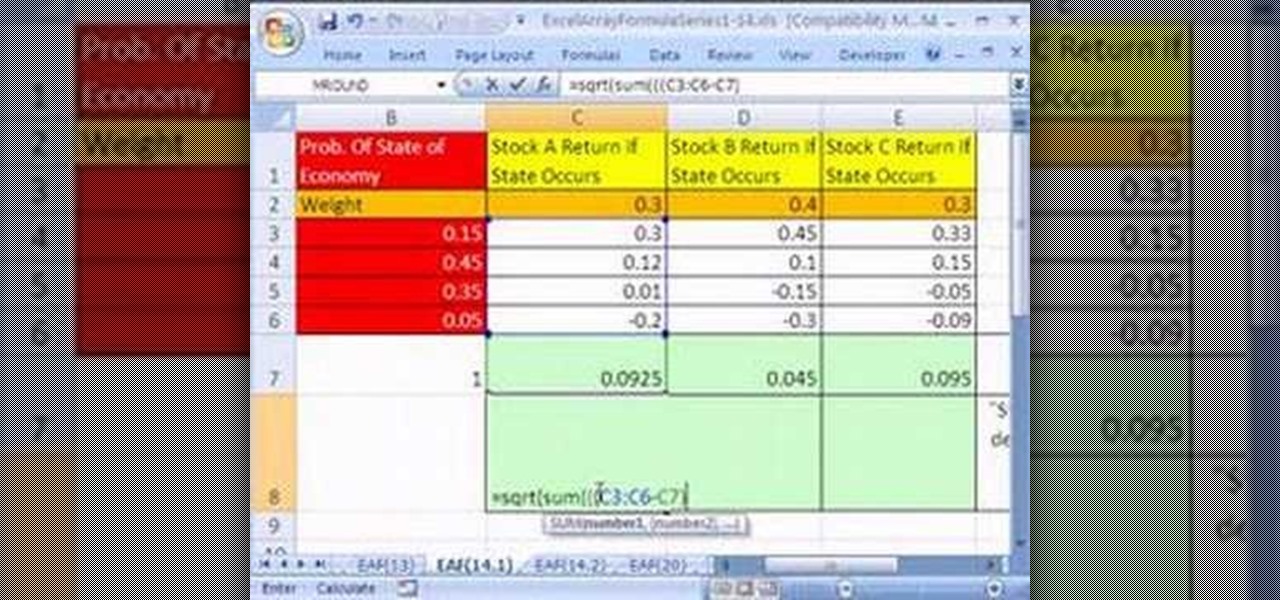
Looking for a primer on how to create and work with array formulas in Microsoft Office Excel? You've come to the right place. In this free video tutorial from everyone's favorite MS Excel guru, YouTube's ExcelIsFun, the 14th installment in his series of Excel array formula series, you'll learn how to create array formulas for individual stock return and standard deviation given different assumed states of the future economy.

Looking for a primer on how to create and work with array formulas in Microsoft Office Excel? You've come to the right place. In this free video tutorial from everyone's favorite MS Excel guru, YouTube's ExcelIsFun, the 12th installment in his series of Excel array formula series, you'll learn how to create array formulas for stock portfolio return & standard deviation.

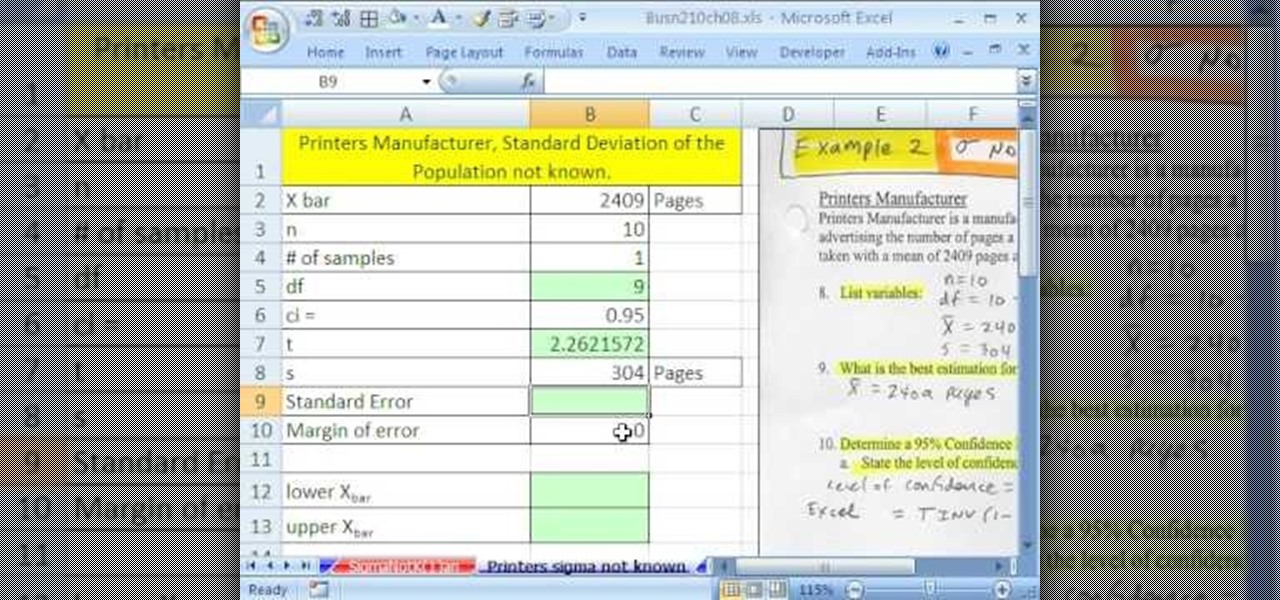
If you use Microsoft Excel on a regular basis, odds are you work with numbers. Put those numbers to work. Statistical analysis allows you to find patterns, trends and probabilities within your data. In this MS Excel tutorial from everyone's favorite Excel guru, YouTube's ExcelsFun, the 83rd installment in his "Excel Statistics" series of free video lessons, you'll learn how to construct confidence intervals when the sigma (population standard deviation) in NOT known using the TINV function.

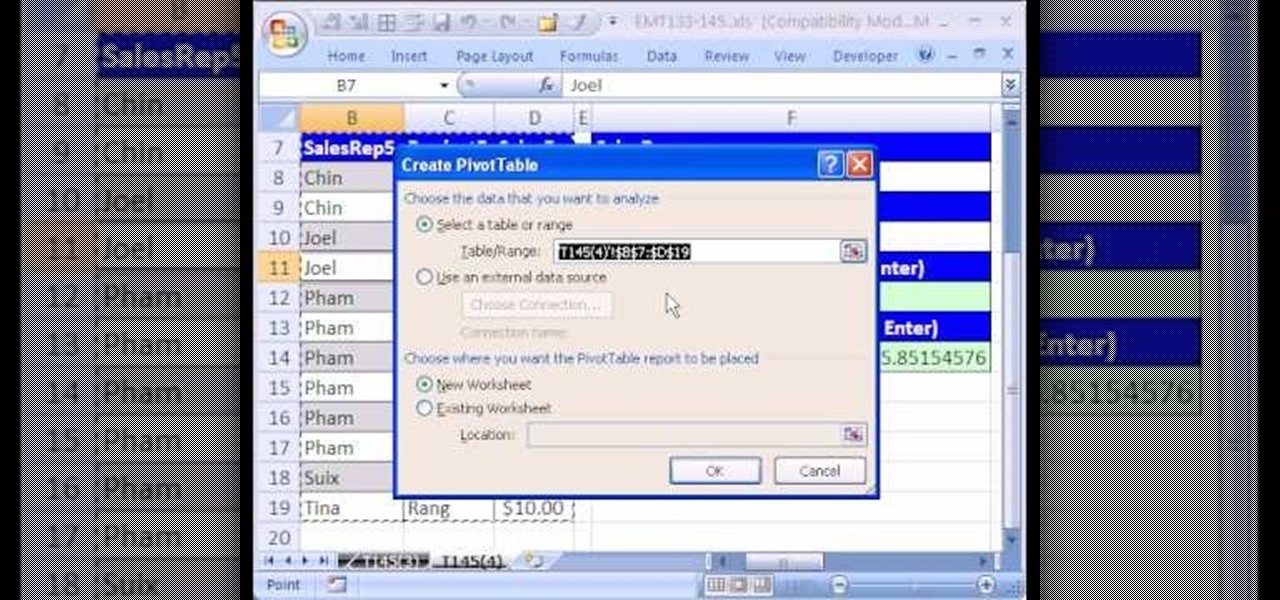
New to Microsoft Excel? Looking for a tip? How about a tip so mind-blowingly useful as to qualify as a magic trick? You're in luck. In this MS Excel tutorial from ExcelIsFun, the 145th installment in their series of digital spreadsheet magic tricks, you'll learn how to create a formula that will calculate the standard deviation when you have more than 1 criterion.

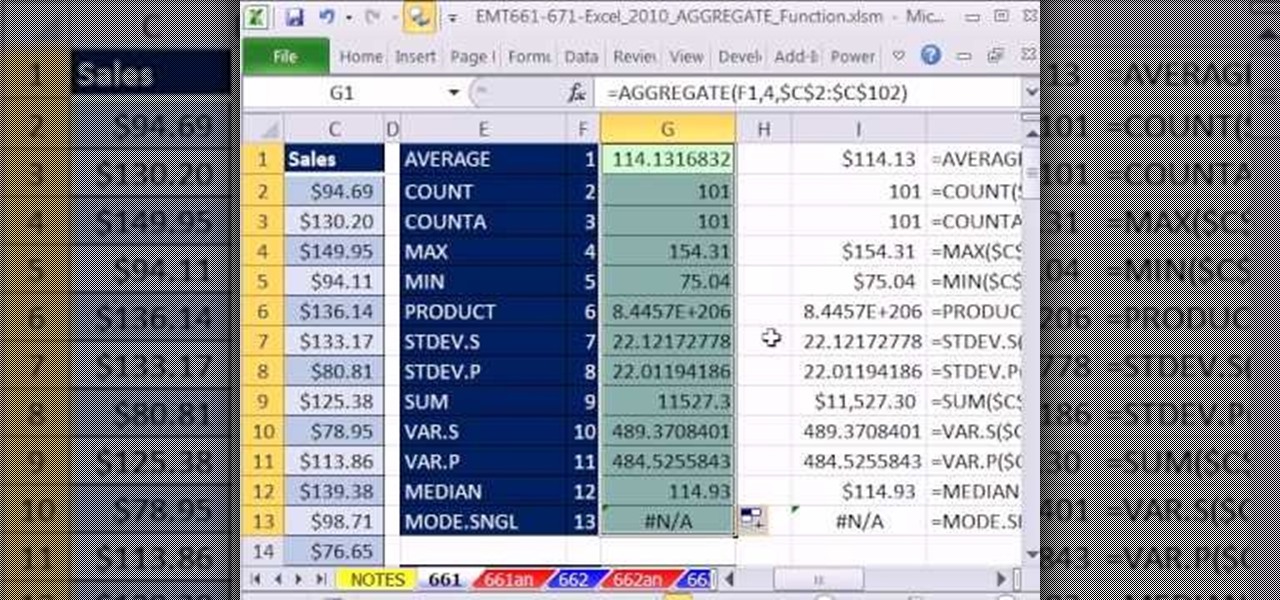
New to Microsoft Excel? Looking for a tip? How about a tip so mind-blowingly useful as to qualify as a magic trick? You're in luck. In this MS Excel tutorial from ExcelIsFun, the 664th installment in their series of digital spreadsheet magic tricks, you'll learn how about how the new Excel 2010 AGGREGATE function that can calculate these 19 different functions depending on what number you put into the 1st argument of the AGGREGATE function. This is an improvement over the SUBTOTAL function wh...

Whether you're interested in learning Microsoft Excel from the bottom up or just looking to pick up a few tips and tricks, you've come to the right place. In this tutorial from everyone's favorite digital spreadsheet guru, ExcelIsFun, the nth installment in his "Highline Excel Class" series of free video Excel lessons, you'll learn how to do basic statistical analysis in Excel. Specifically, this video covers the following topics:

Whether you're interested in learning Microsoft Excel from the bottom up or just looking to pick up a few tips and tricks, you're in the right place. In this tutorial from everyone's favorite digital spreadsheet guru, ExcelIsFun, the 21st installment in his "Highline Excel Class" series of free video Excel lessons, you'll learn how to add conditional formatting to data bars and icons to show relative size, icons to show relative size, to highlight values within 1 standard deviation, to highli...

If you use Microsoft Excel on a regular basis, odds are you work with numbers. Put those numbers to work. Statistical analysis allows you to find patterns, trends and probabilities within your data. In this MS Excel tutorial from everyone's favorite Excel guru, YouTube's ExcelsFun, the 82nd installment in his "Excel Statistics" series of free video lessons, you'll learn how to construct confidence intervals when the sigma value (the population's standard deviation) in NOT Known using the TINV...

If you use Microsoft Excel on a regular basis, odds are you work with numbers. Put those numbers to work. Statistical analysis allows you to find patterns, trends and probabilities within your data. In this MS Excel tutorial from everyone's favorite Excel guru, YouTube's ExcelsFun, the 81st installment in his "Excel Statistics" series of free video lessons, you'll learn how to construct confidence intervals when the sigma (population standard deviation) is known. See how the CONFIDENCE and NO...

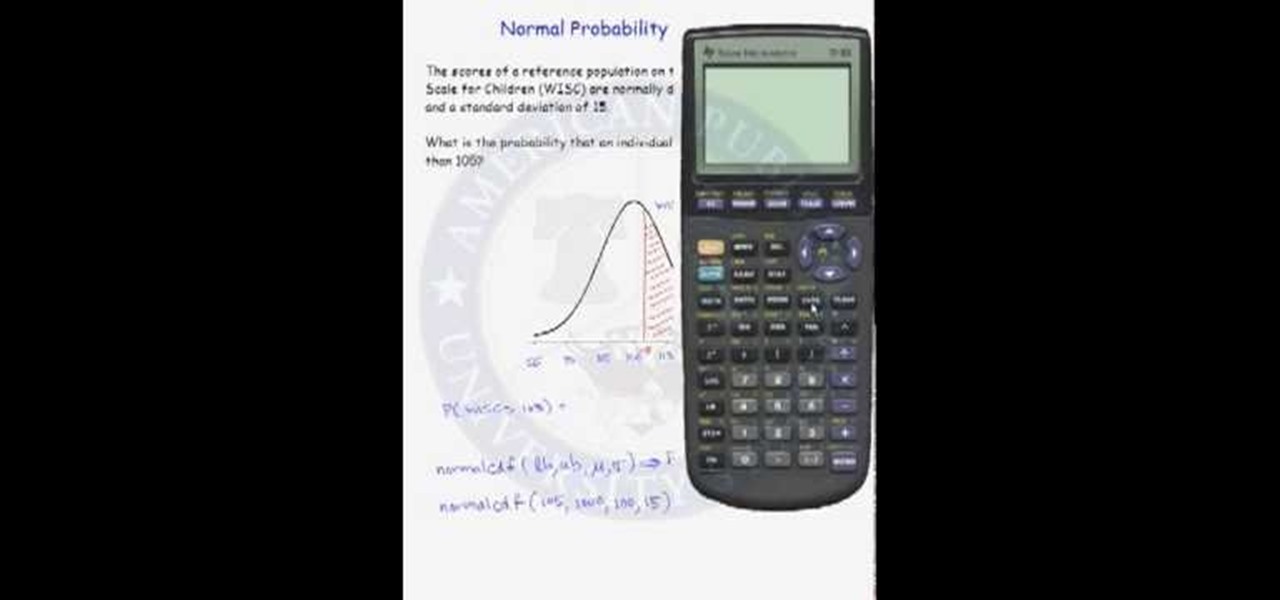
Probability computation is a complex process and even using a calculator can be difficult. But normal probability calculations can be performed quickly with the help of calculator once you know how to use it. So when you have to calculate a probability from a normal distribution you can use the functions on your scientific calculator. You can use the normal CDF function from you calculator to compute the area under a normal curve. The function requires lower band and upper band values, the me...

Economists have long since known that people want to be rewarded for taking on risk. Investments are thus judged by their risk-adjusted returns (Sharpe ratios). A typical hedge fund has a Sharpe ratio of around 0.5. This means that its excess annual return over the risk-free rate is about half its annual standard deviation.

If you don't know exactly what goes on during Hanukkah, this series of videos will set you straight. Hanukkah is the most recognized Jewish holiday, right around Christmastime, and Chaim from Maoz Israel is going to show you some traditional customs that are performed during the eight days of Hanukkah 2010. Learn about the menorah, sufgaiyots, the mysterious dreidel and the traditional Chanukah songs.

The video is about how to find the variance of the set of data. They found the variance by using the variance formula. Variance formula was represented by square of S, whereas S is the Standard Deviation.

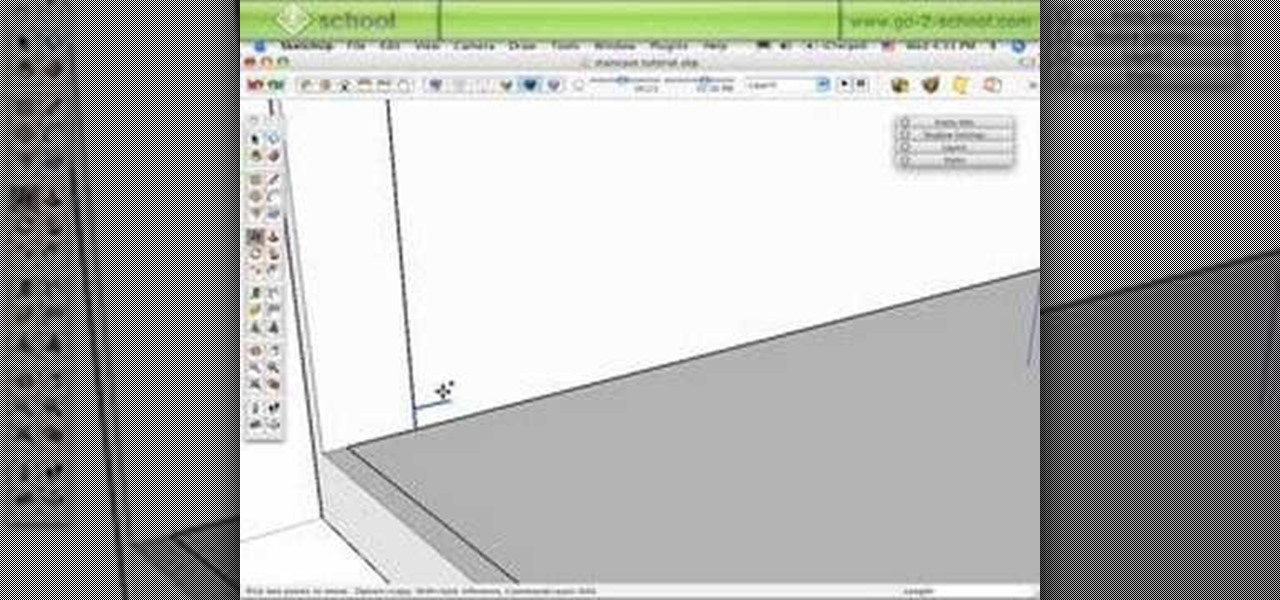
It's one thing to learn how to model a building in SketchUp, and if you are a new SketchUp user you may not remember that multi-level buildings will need a staircase! Mike demonstrates a few different methods to create both standard and spiral staircases in this SketchUp 6 tutorial.

This medical instructional how-to video demonstrates the proper way to perform a standard venepucture procedure on a patient. Before drawing blood from any patient it is always good to identify your patient. Wrap the band at the top of the arm and use alcohol to clean the area. Watch to learn how to perform a standard venepuncture procedure.

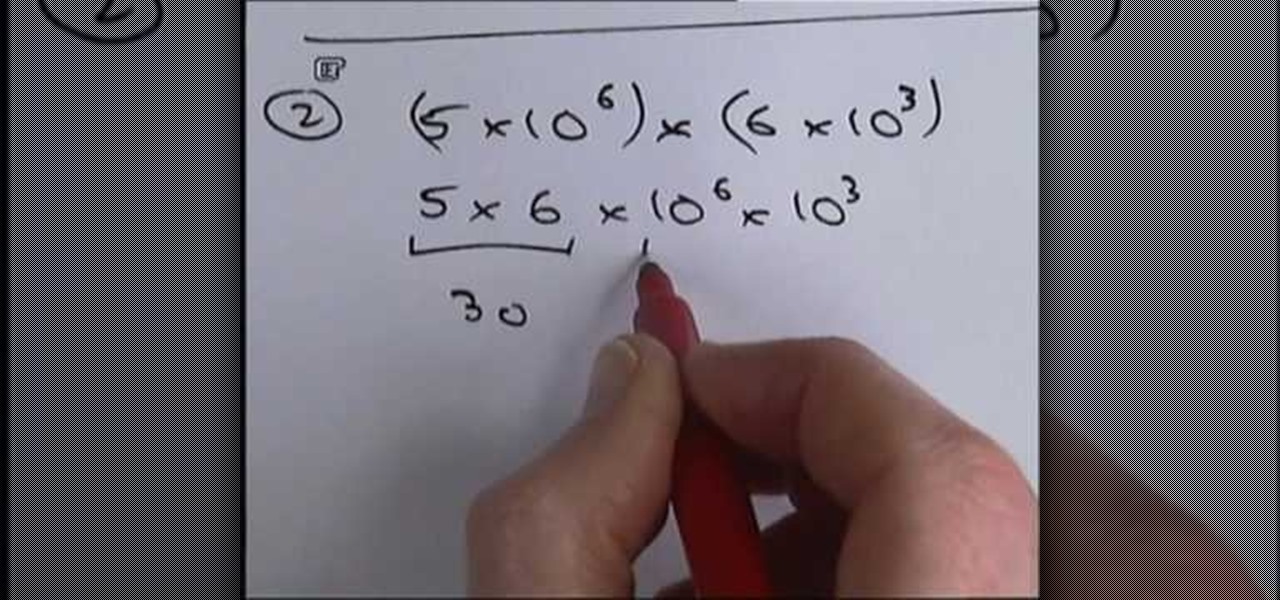
When a number is expressed in the form of x multiplied by 10^y such that, x < 10 and y is an integer, the number is said to be in standard form. Standard form of expressing numbers finds its use in scientific and statistical fields. This video demostrates how to express, as well as perform basic mathematical operations namely, addition/subtraction, multiplication and division of numbers in the standard form using four examples/mathematical problems. The first two examples demostrate multiplic...

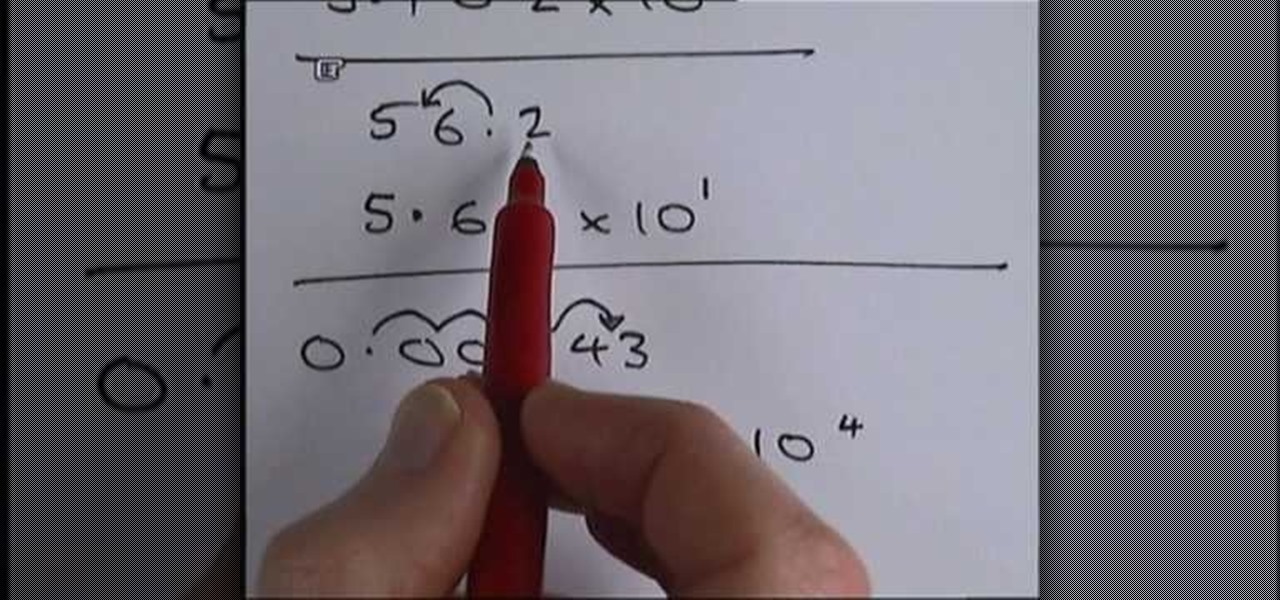
In this video, we learn how to convert numbers in and out of standard form. Standard form is a useful way of writing down very large numbers and very small numbers. To do this, you will look at the number you have and ignore the zeros that are just at the end. Then, write down the basic numbers. Put a decimal point in this number to make it between one and ten. Now, write down x 10 and put the power for how many places the decimal point moved to get to the new number. This will help you write...

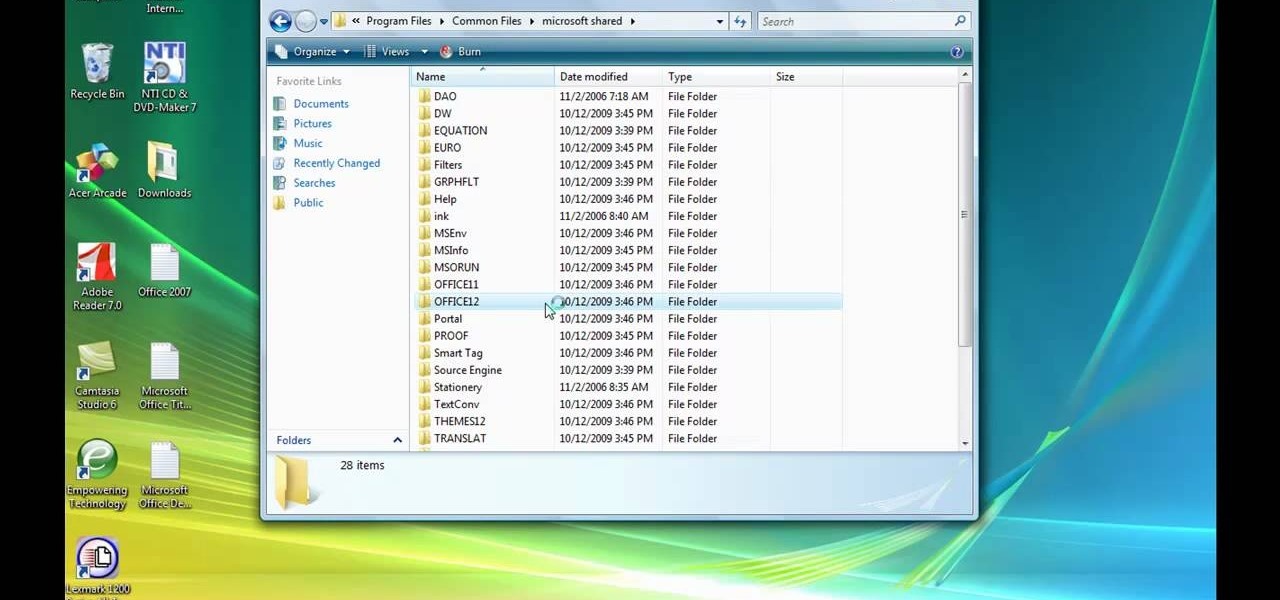
Chances are if you've used a computer in the last decade or so, you've probably used Microsoft Office at some point. Activating Microsoft Office standard 2007 will give you access to functions you might not have even known existed that can increase your productivity and improve your work flow. This video will show you to activate Microsoft Office standard 2007.

In this AeroCast episode, UND Aerospace discusses the Slow Flight maneuver as performed in the Piper Warrior (PA-28-161), referencing the procedures and standards outlined in the UND Warrior Standardization Manual. All performance tolerances are based on the performance standards set forth by the FAA Private Pilot Practical Test Standards. Since the most critical phases of flight occur at airspeeds less than cruise, a pilot must always be comfortable with his or her airplane’s handling charac...

In this AeroCast episode, Anthony Bottini discusses the Power On Stall maneuver as performed in the Piper Warrior (PA-28-161), referencing the procedures and standards outlined in the UND Aerospace Warrior Standardization Manual. All performance tolerances are based on the performance standards set forth by the FAA Private Pilot Practical Test Standards. Power On Stall practice is vital in increasing a pilot’s proficiency in regards to stall recognition and stall recovery techniques during an...

Welcome back, my budding hackers! In previous tutorials, we've looked at some of the basic commands and concepts for using Linux. Along the way, I realized that I've failed to provide you with some basic background material on the stdin, stdout, and stderror.

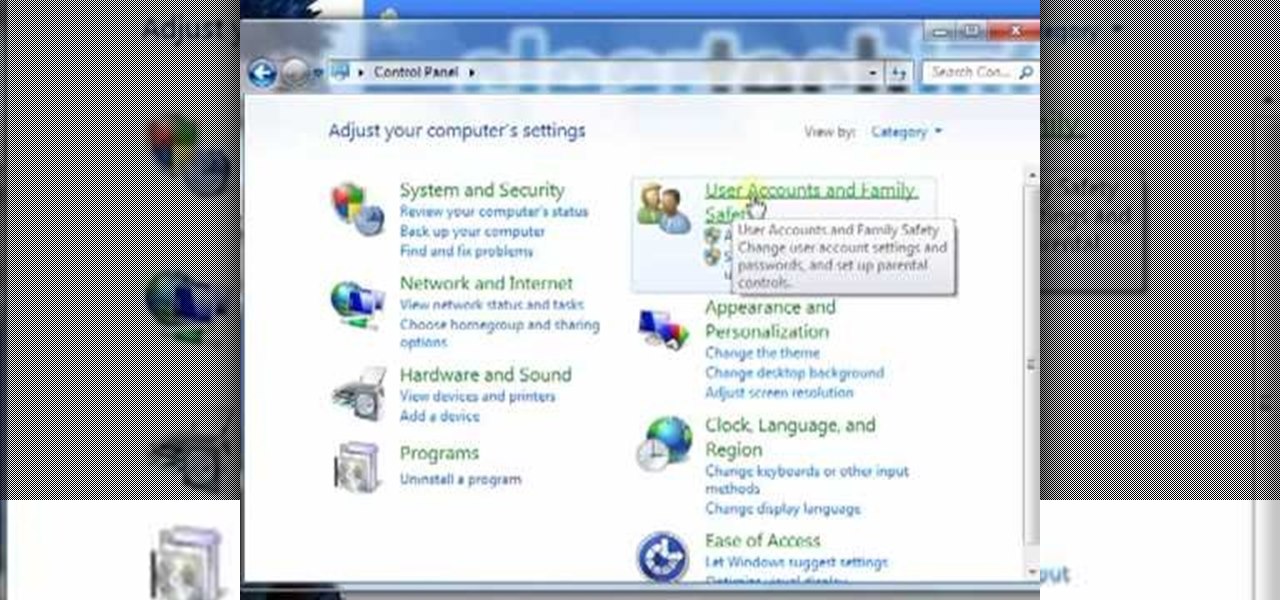
In this video tutorial, viewers learn how to create a new standard user and administrator account. Begin by clicking on the Start menu and select Control Panel. Then click on User Accounts and Family Safety and click on User Accounts. Now select the "Manage another account" option and click on "Create a new account". Users are able to name the account and select the account type (Standard or Administrator). Finish by clicking on Create Account. Users are then able to make changes to the accou...

Jazz music, along the lines of jazz greats like Coltrane and Thelonius Monk, is usually associated with the piano and the sax (as well as backup clarinets, oboes, etc.). But an equally fit instrument for playing jazz tunes is the acoustic guitar, which offers a light contrast to the larger, deeper toned instruments.

Learn how to do the standard skills in Fifa 09, it looks like every player in the game can do these. These are special tricks, but they are necessary if you want to play online or ever score. This includes a foot flick, slide tackle, 360 roulette and reverse stopovers.


