The first time many people dye their hair they use hydrogen peroxide. Perhaps as a teenager or ignorant college student they just walk into a supermarket, and buy the liquid, and go home and apply it. The result is usually dry blonde hair, which starts breaking in the process. Using hydrogen peroxide to bleach hair is affordable and can give great results but only if used well.
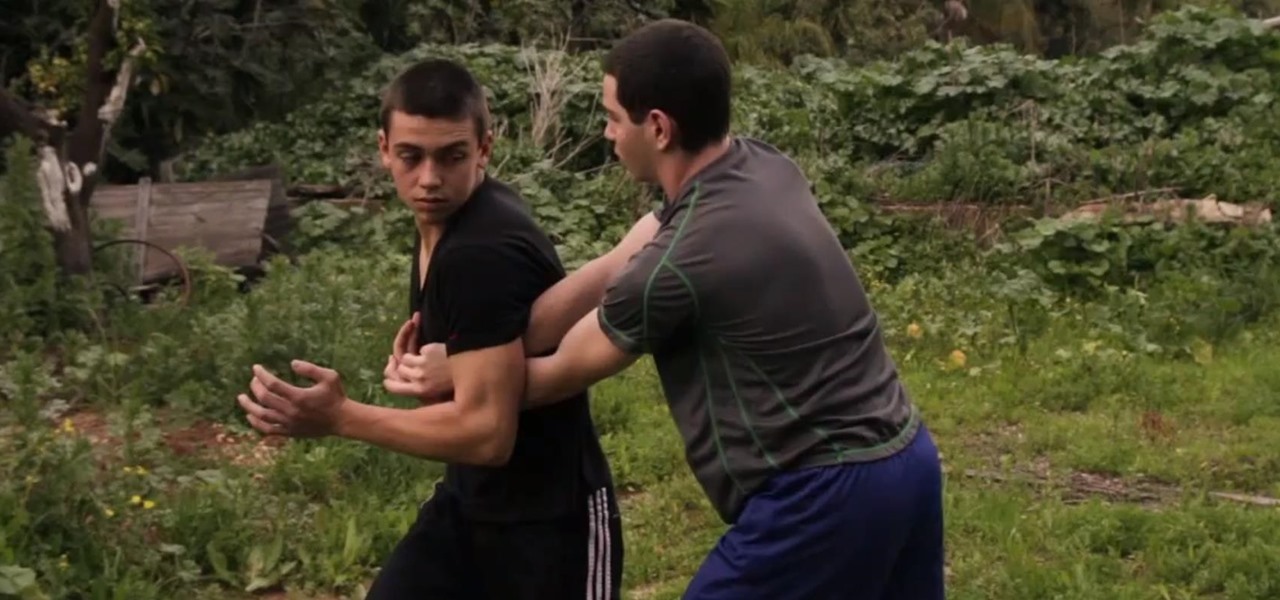
Would you want to be able to defend yourself and your loved ones if someone were to physically attack you? This video will show you how to defend yourself against an attacker choking you from the front. It' the best MMA for self-defense, especially for a teenager.
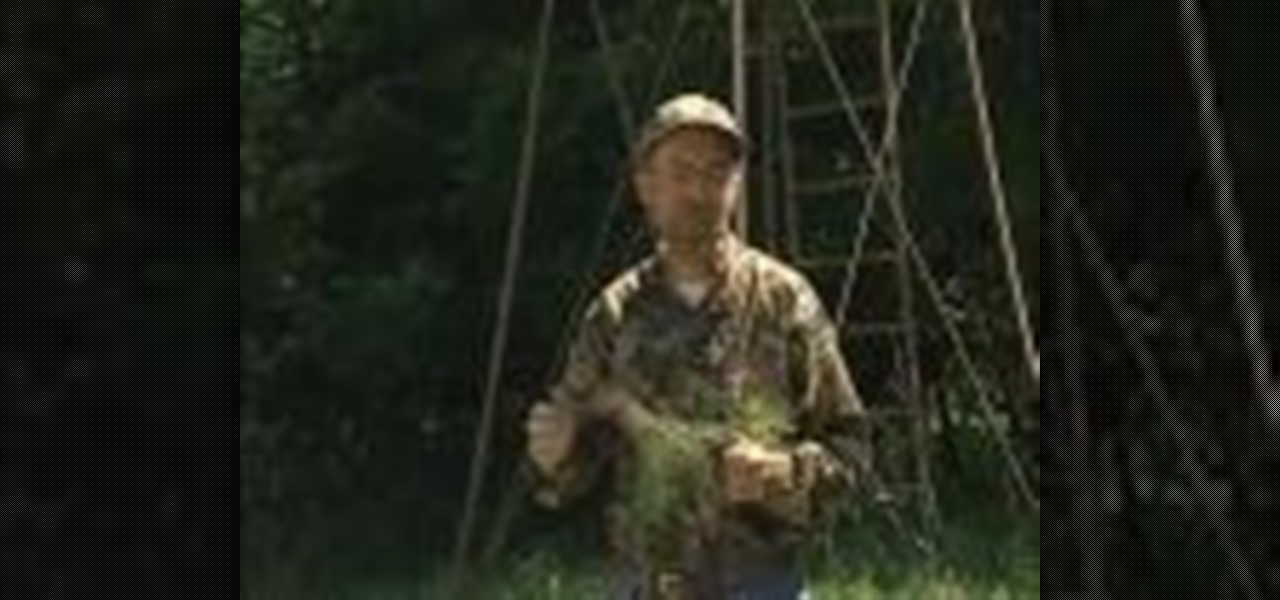
If you're wondering about food plots and why they are important when hunting, check out the tutorial above. In the video, Dr. Grant Woods, a wildlife biologist, talks about the importance of food plots and how they can be used to help maximize your hunting capabilities. These food plots are perfect areas for deer to rest near and spend their time around. So sit back, pay attention, and enjoy!
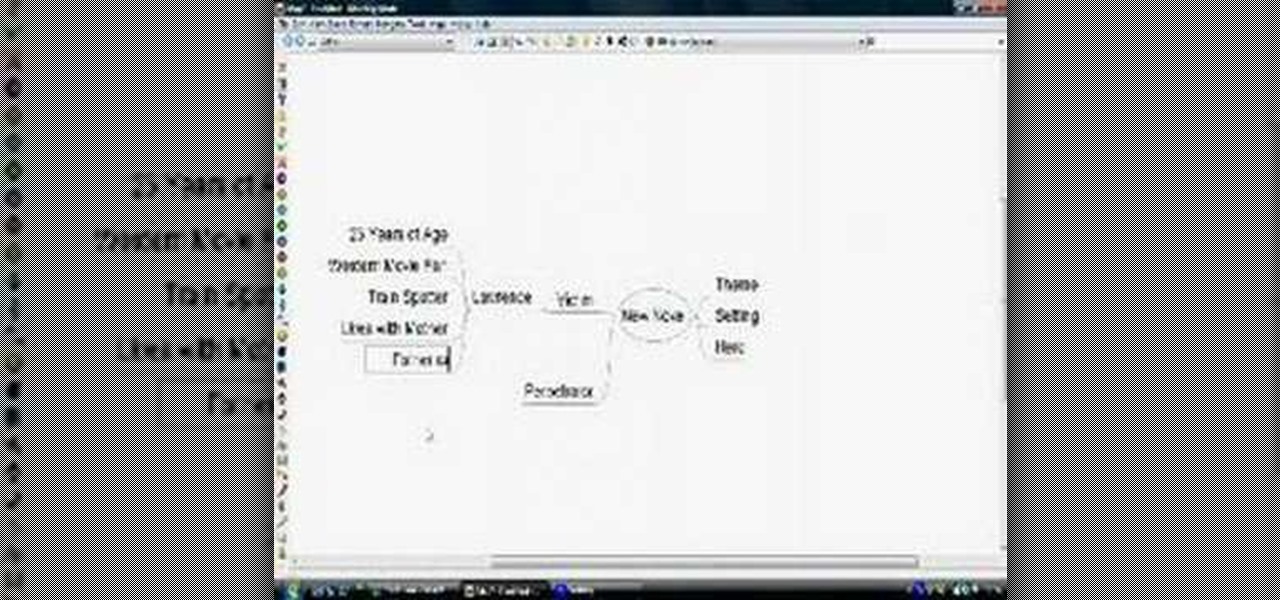
You can download Freemind for free from SourceForge.net, which will let you create and customize your own mind maps. These, in turn, you can use to plot a dramatic and exciting crime novel by organizing all the different aspects of the story, such as plot, setting, characters and motive.

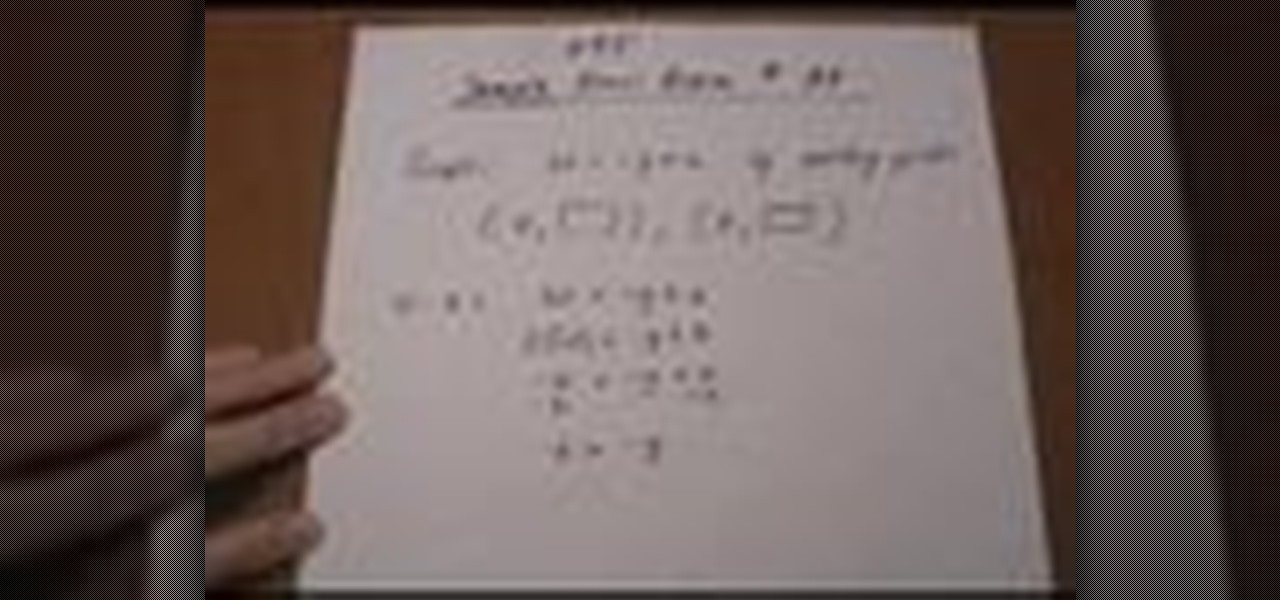
How do you plot an ordered pair on a x, y grid? This video will explain everything, from the very basic idea to how to actual application. In this step by step tutorial, the viewers will be exposed to the techniques and skills required to accurately plot an ordered pair on the x, y grid. Each instruction is given with much clarity and explanation. Therefore, the viewers should have absolutely no problem plotting by themselves after viewing this tutorial video.
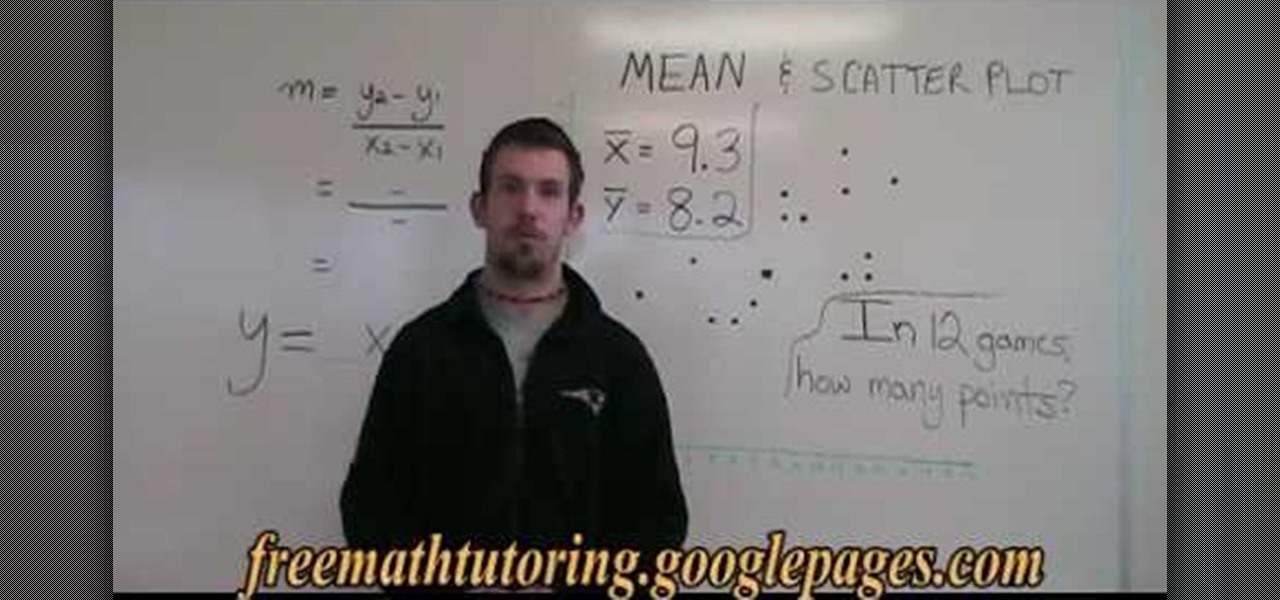
Wondering how to use a mean and scatter plot for statistics? Just follow the few simple steps as below.

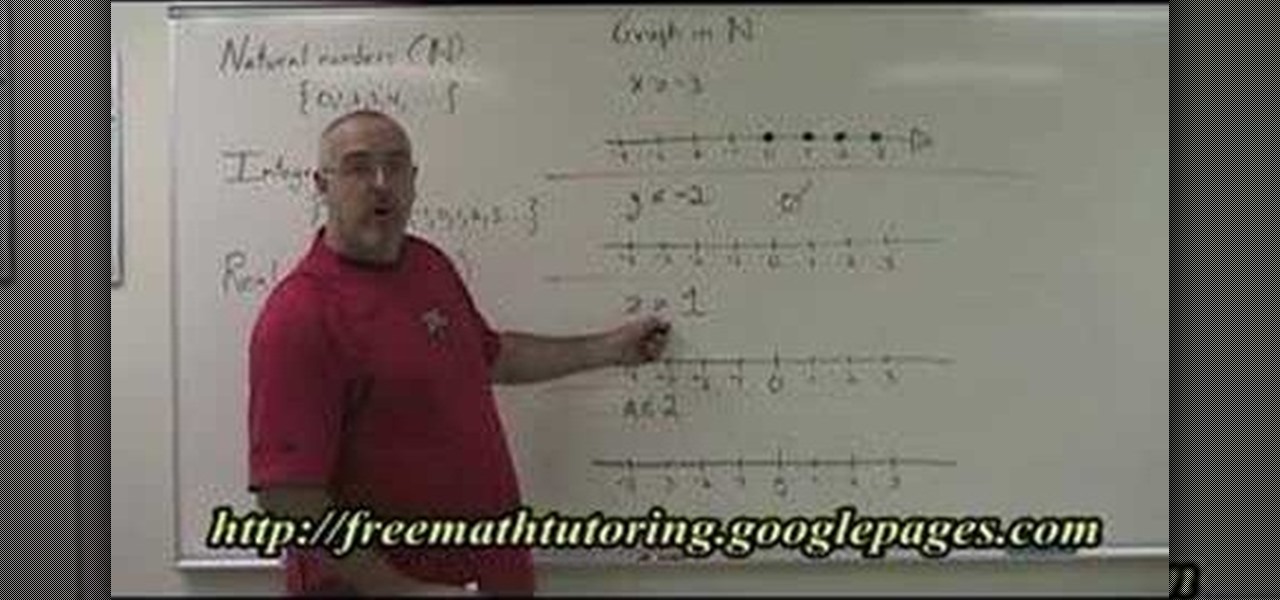
The video described here from [free math tutoring Freemathtutoring] teaches how to plot natural number on a number line in different situations. First, the author defines natural numbers, integers and real numbers. He then teaches different methods on how to plot natural numbers on a number line. The most important fact to remember is that natural numbers are greater than 0; they do not include negative numbers. Like wise, he explains different situations to plot natural numbers on a number l...
If you use Microsoft Excel on a regular basis, odds are you work with numbers. Put those numbers to work. Statistical analysis allows you to find patterns, trends and probabilities within your data. In this MS Excel tutorial from everyone's favorite Excel guru, YouTube's ExcelsFun, the 27th installment in his "Excel Statistics" series of free video lessons, you'll learn how to create a quantitative data dot plot chart using the REPT and COUNTIF functions.
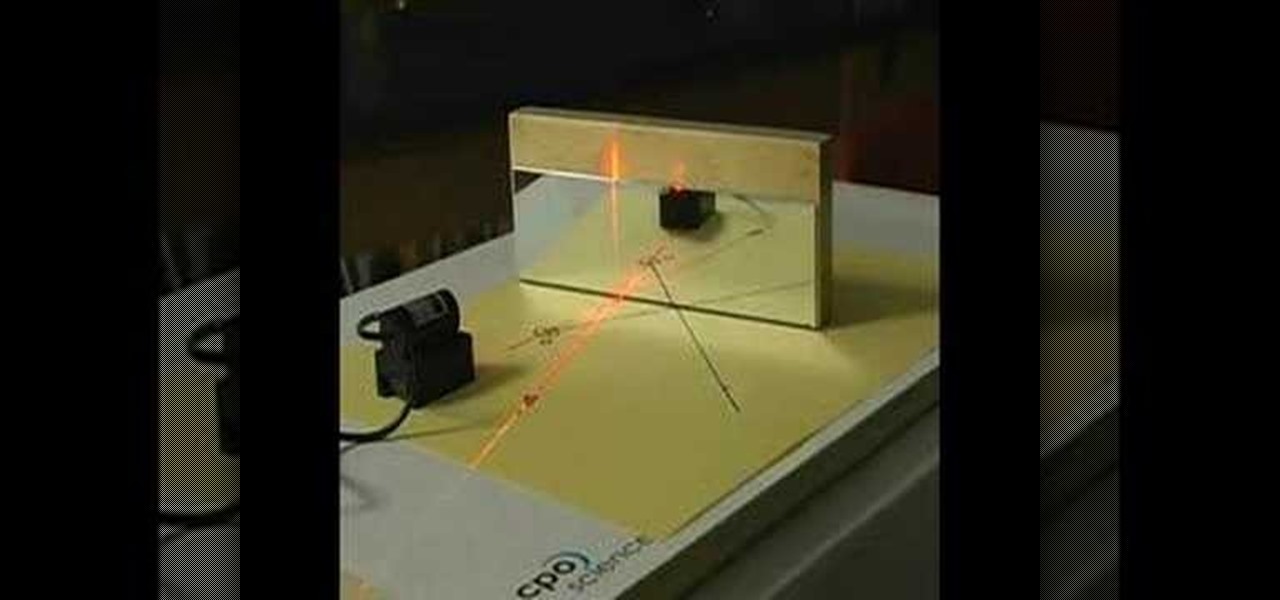
For both reflection and refraction scenarios, ray diagrams have been a valuable tool for determining the path of light from an object to our eyes.
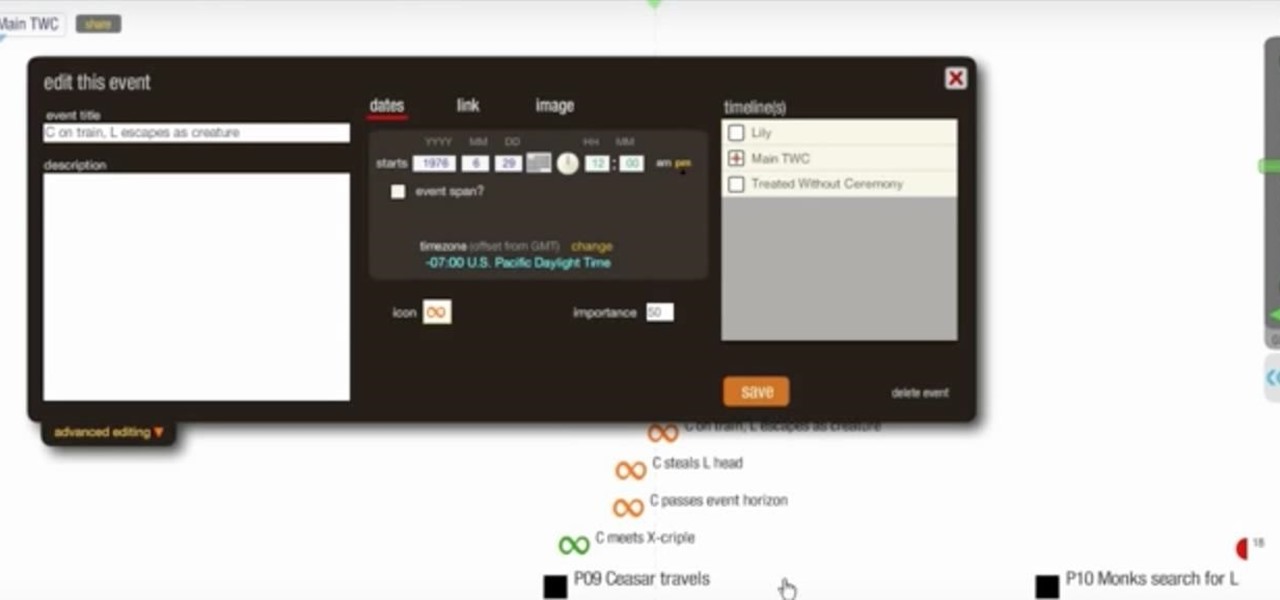
Every budding writer needs to be able to work out the order of events that make up the plot, and one of the best ways to do this is to design an timeline. Learn how to organize your events and tighten up your plot when you utilize a timeline.
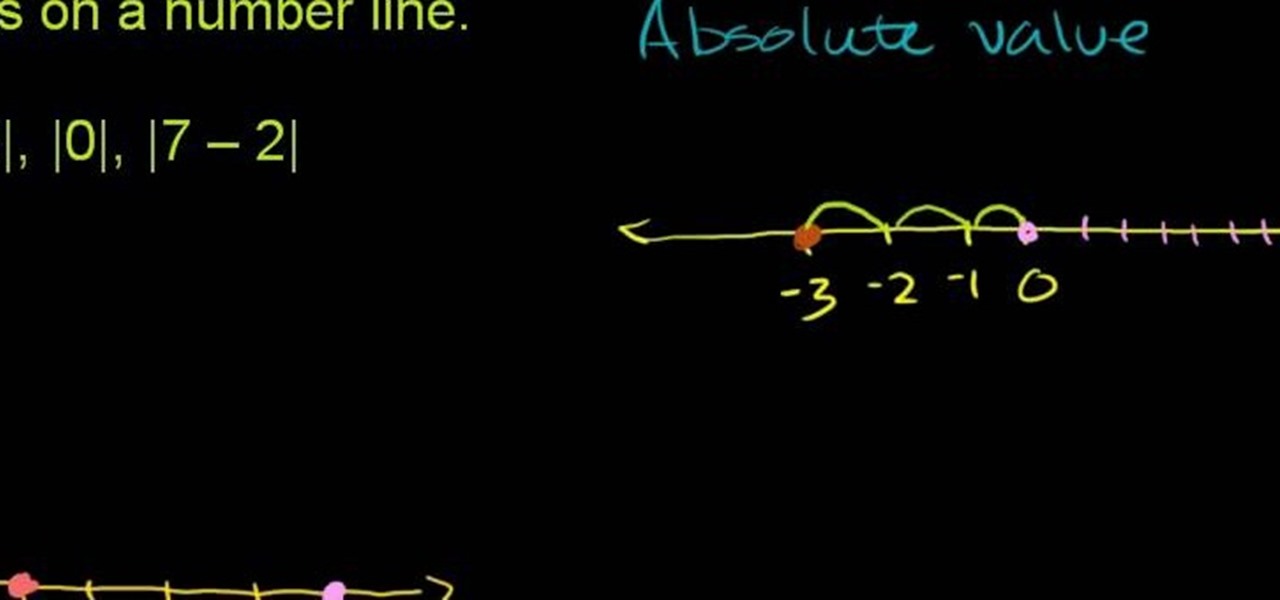
From Ramanujan to calculus co-creator Gottfried Leibniz, many of the world's best and brightest mathematical minds have belonged to autodidacts. And, thanks to the Internet, it's easier than ever to follow in their footsteps (or just finish your homework or study for that next big test). With this installment from Internet pedagogical superstar Salman Khan's series of free math tutorials, you'll learn how to plot absolute values on a number line in simple algebra/geometry.
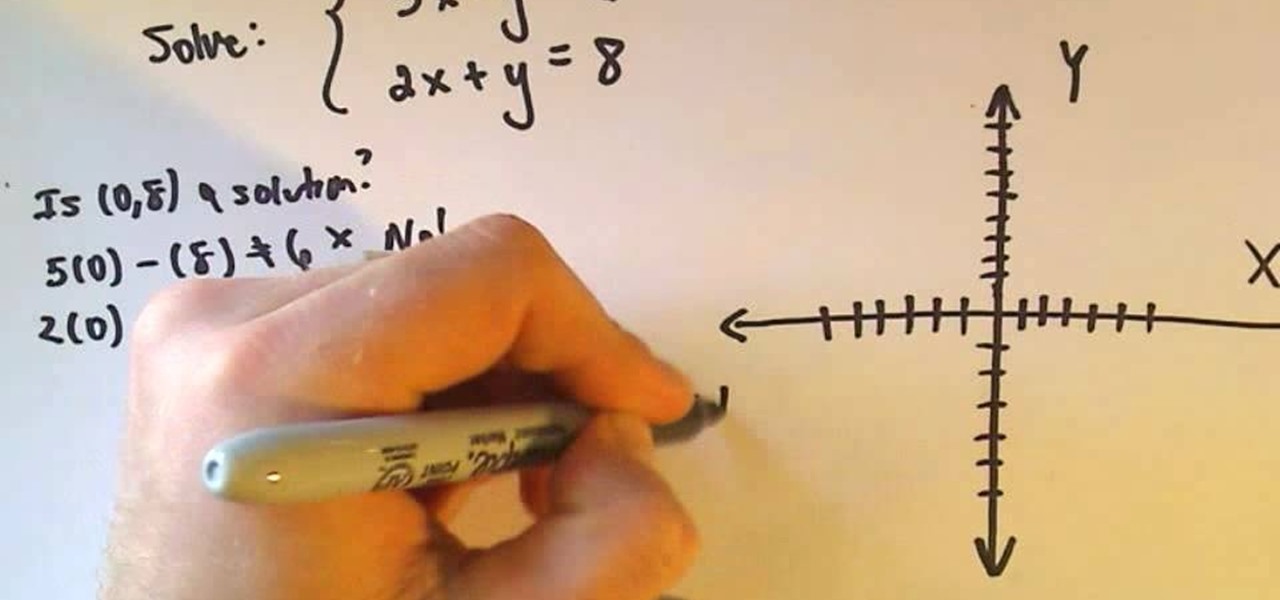
This video shows the method to solve a pair of linear equations by plotting their graph. Look for points of intersection of the two graphs which is the solution. Let us solve 5x-y=6 and 2x+y=8. Writing the equations of lines in slope intercept form, we get y=5x-6 and y=-2x+8. Now we plot the two lines. For the slope 5 or 5/1, we go up 5 units and left 1 units from the point of intersection on the y axis. For -2 or -2/1, we go down 2 units and left 1 units from the point of intersection on the...
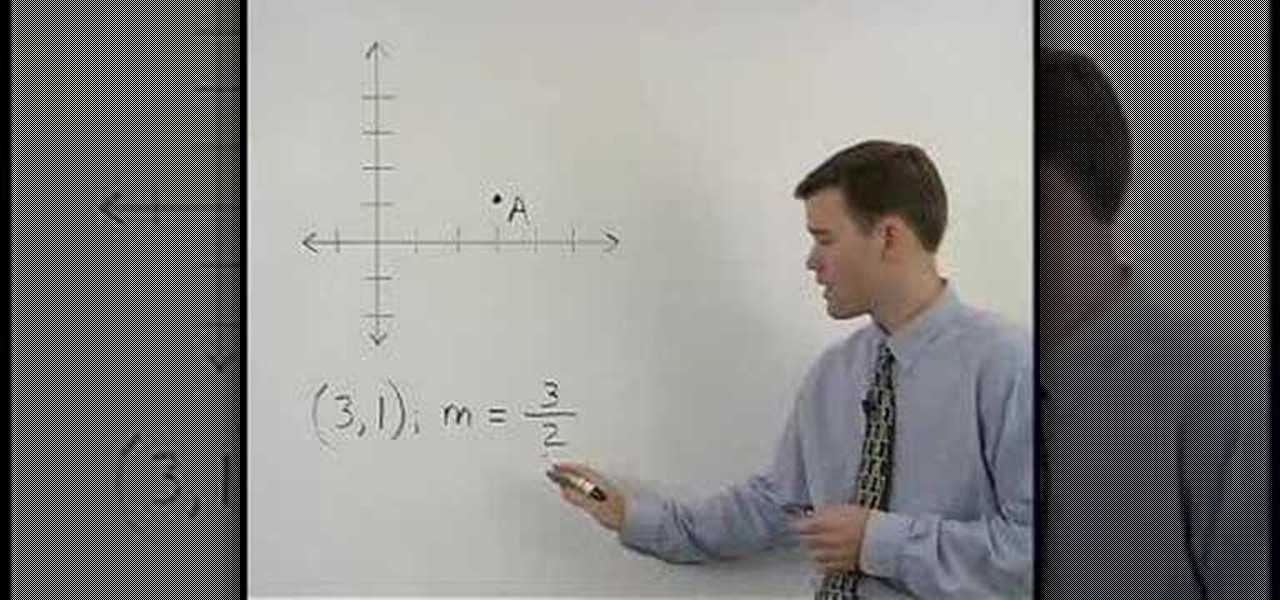
Given a point through which a line passes and the value of its slope you can graph the line. To do this first plot the given line. Now taking the slope and using the rise over run method plot a second point. Connect these two points and this gives you the graph of the line. Extend this line further on both sides to get the complete line. The point where this line cuts the x-axes is called the x-intercept and the point where this line cuts the y-axes is called the y-intercept. The important po...
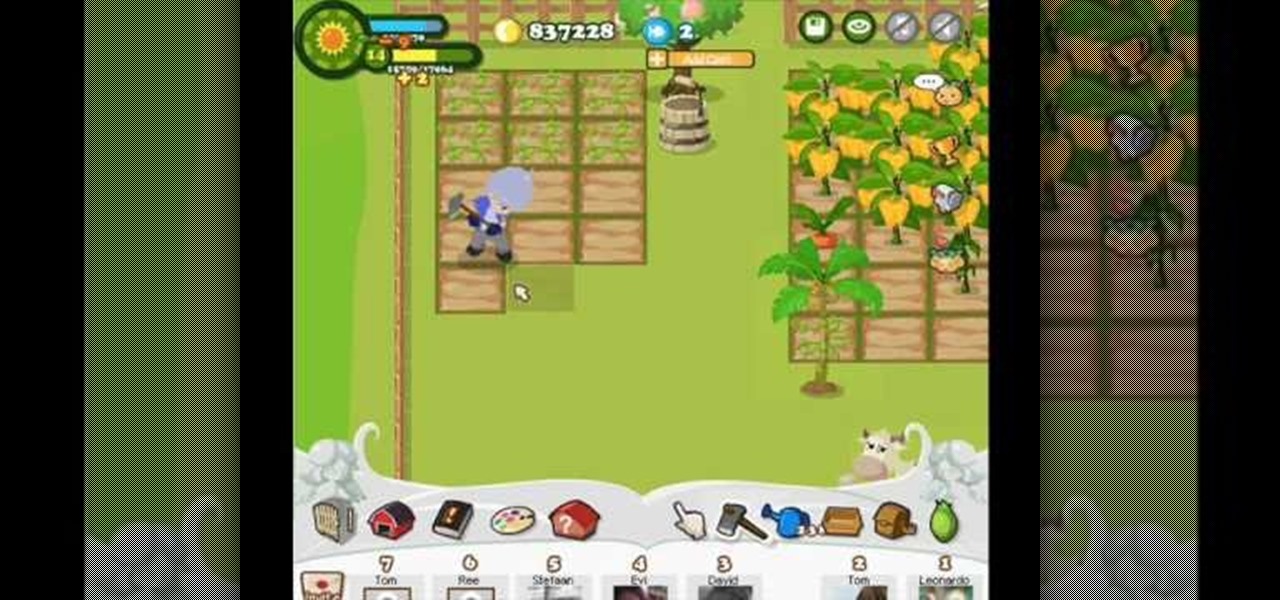
Country Story hacks, cheats, glitches. How to hack Country Story. Watch this video tutorial to learn how to plot hack Country Story on Facebook (08/22/09).
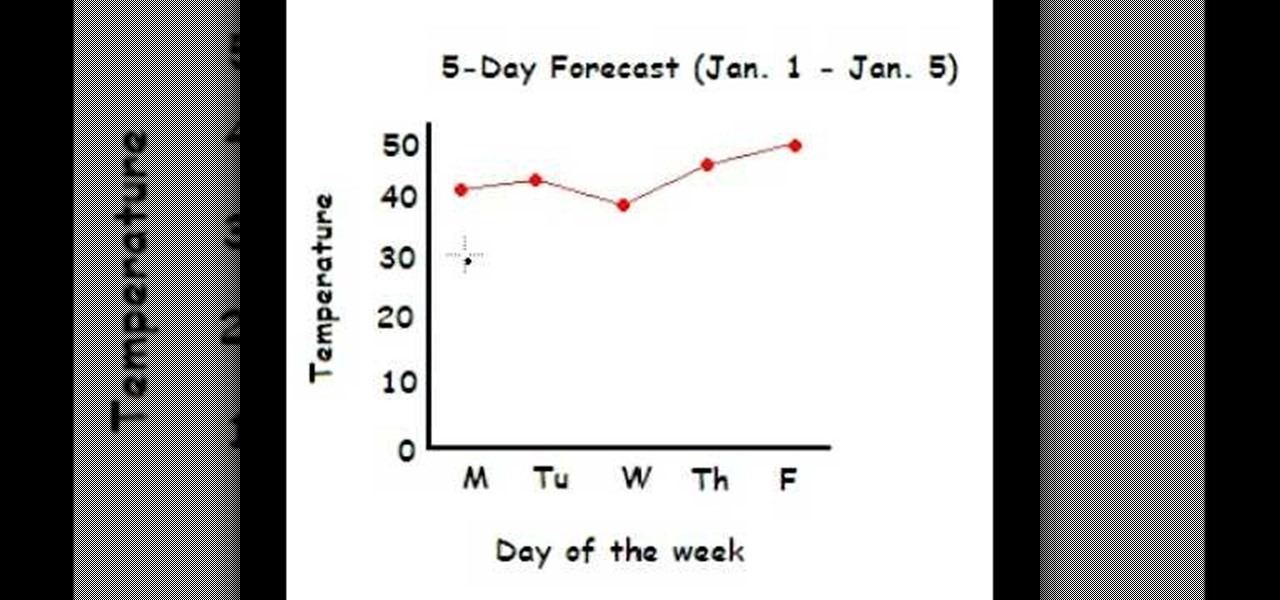
This video shows the method to make a line graph. First step involves drawing a horizontal and vertical line joined at one end. We have to plot the maximum and minimum temperatures during 5 days. Label the vertical with the temperatures(10, 20, 30...50) and the horizontal line with the days of the week(Monday....Friday). Label the vertical line as 'Temperature' and the horizontal line with 'Day of the week'. Plot the temperatures selecting the day from the horizontal line and marking at the c...
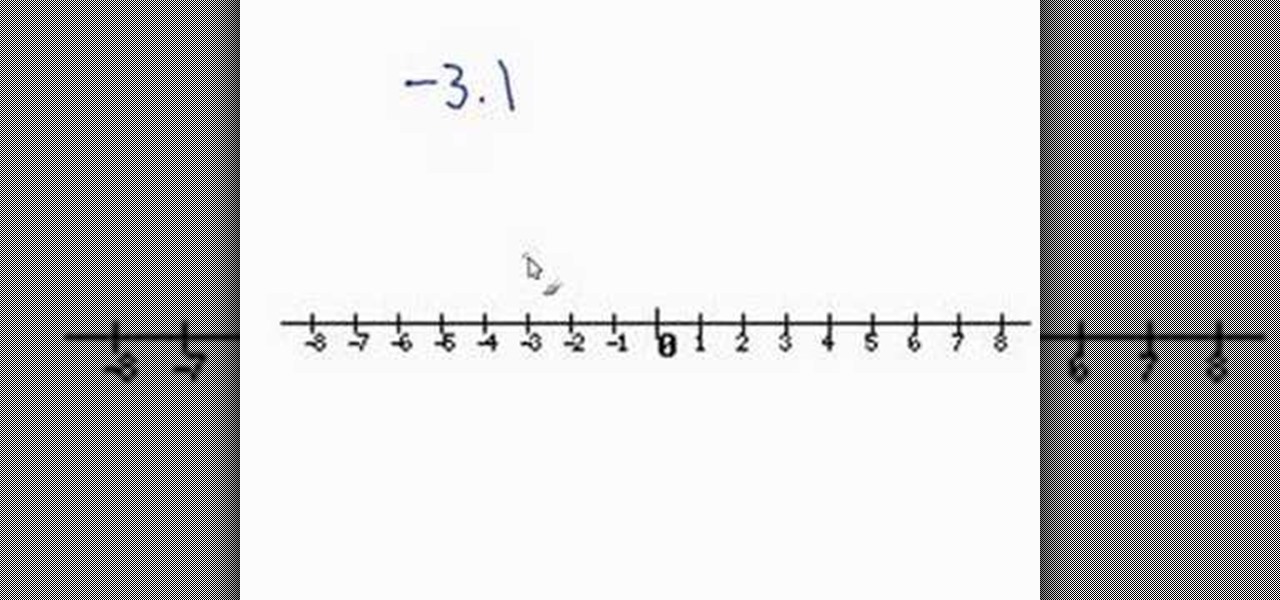
This video tells you how to plot a real number on a number line. For example consider -3.1. You know -3.1 lies between -3 and -4. You also know -3.1 lies very close or next to 3. So all you have to do is, put a point just before -3. Now you have marked -3.1 on a number line. Similarly you can point any real number on a number line. It is quite an easy job to plot real numbers on a number line.
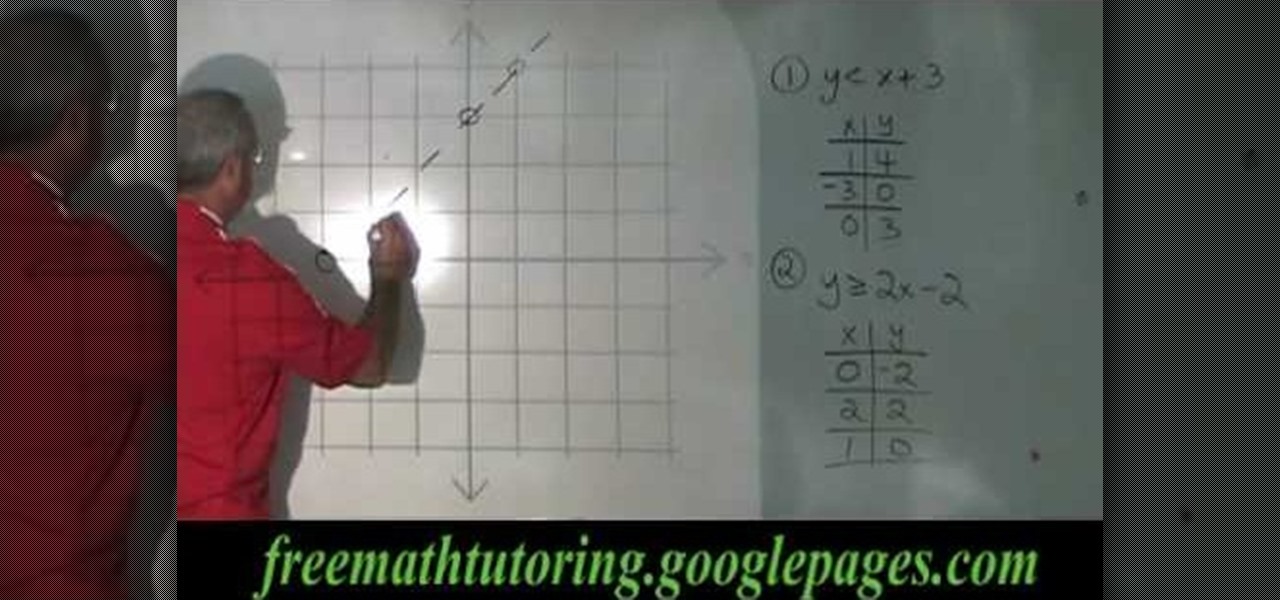
In this video the tutor shows when to use a dotted line and when to use a solid line while graphing lines in coordinate geometry. He says that we should use a dotted line to plot an inequality which contains the symbols less than or greater than. He also says that we should use a straight line when plotting an inequality which contains the signs less than or equal to and greater than or equal to. He goes on and demonstrates this idea with some examples. This video shows how to use different l...
This video will show you how to stack plow in Facebook's Flash game Farm Town. This only works if you are using Internet Explorer (IE). This involves making a plot and then stacking a second plot atop the first plot. This is stack plowing. This is a cool cheat for Facebook's Farm Town.
Everybody had a yo-yo at one point in their life; some when they were just little children, some when they were bored teenagers, some when they found the kid inside of them they never knew of, and even some when they felt retirement was just not very fun. It just goes to show that the yo-yo is not going anywhere anytime soon. Who could ever believe that a toy consisting of two equal disks made of plastic, maybe even wood or metal, with an axle and string could be so damn pleasing, so much dar...
Everybody had a yo-yo at one point in their life; some when they were just little children, some when they were bored teenagers, some when they found the kid inside of them they never knew of, and even some when they felt retirement was just not very fun. It just goes to show that the yo-yo is not going anywhere anytime soon. Who could ever believe that a toy consisting of two equal disks made of plastic, maybe even wood or metal, with an axle and string could be so damn pleasing, so much dar...
The scenario: The Super Bowl. The stakes: Humiliation. The results: Incredibly satisfying. Learn how to plot the most humiliating sports bet ever. You will need someone to bet against, your team's jersey, face paint, coasters, a razor, a poker game, and an (optional) bikini wax.
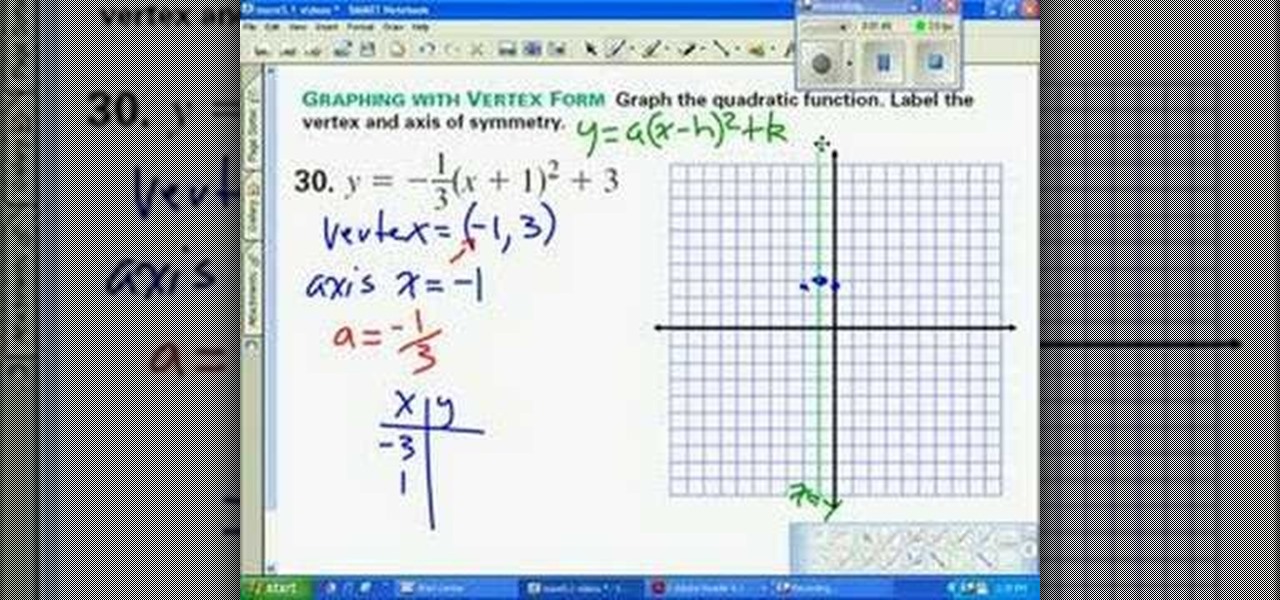
This video shows viewers who are interested in mathematics how to graph a parabola whose formula is displayed in vertex form, or the form y=a(x-h)^2+k, where the vertex is (h, k). After determining the vertex, plot it on your graph. After graphing your vertex, your axis of symmetry would be x= h, or the x-coordinate of your vertex. The a value in your equation will act as your slope in this case, and your should graph the two points which correspond to this slope on your plot 1 unit away on e...
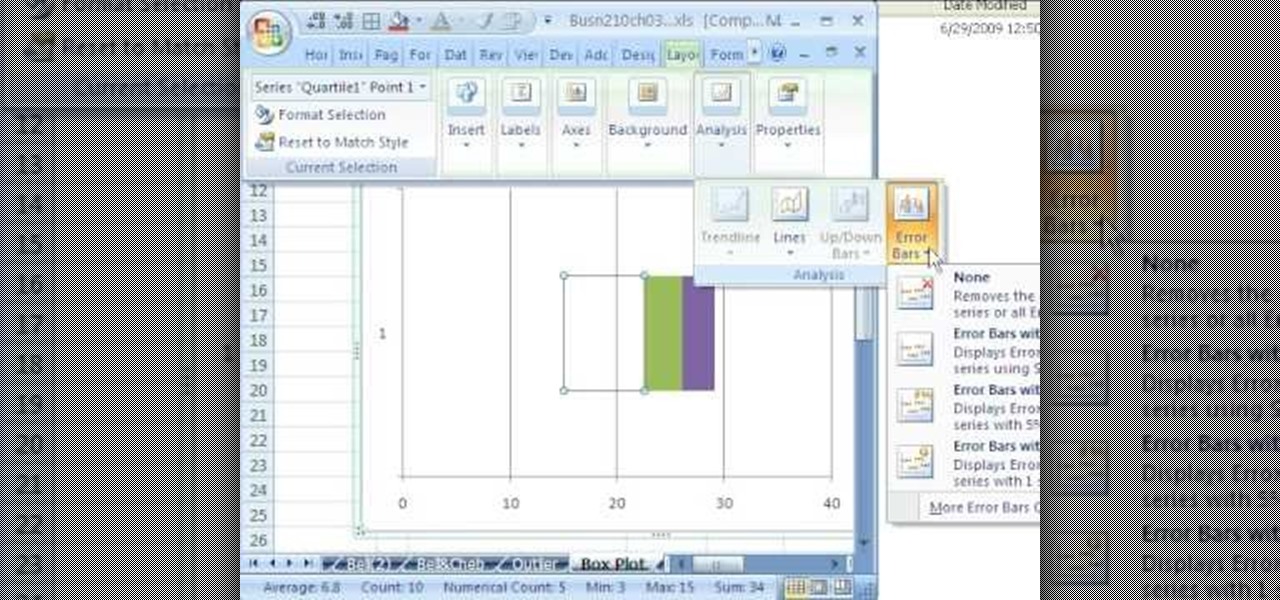
New to Excel? Looking for a tip? How about a tip so mind-blowingly useful as to qualify as a magic trick? You're in luck. In this Excel tutorial from ExcelIsFun, the 124th installment in their series of digital spreadsheet magic tricks, you'll learn how to create a box plot or box-&-whisker chart using a stacked bar chart and a open-high-low-close stock chart. You'll also learn how to use the QUARTILE function.
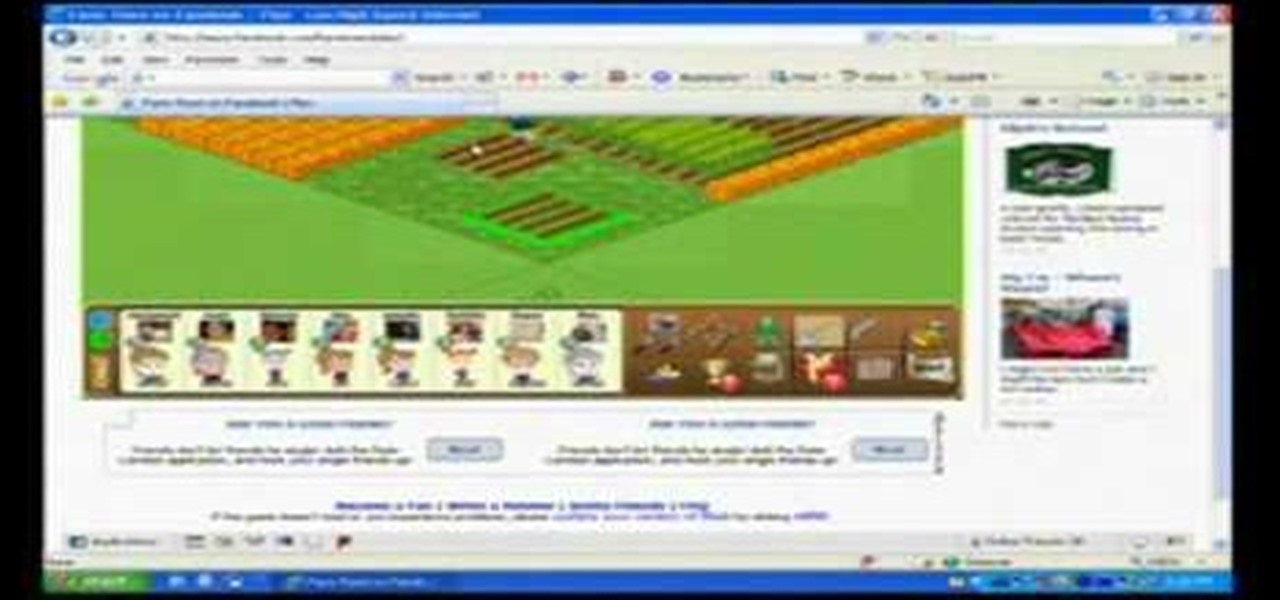
Facebook is the number one Social Networking site that hosts the number way farming game, FarmVille! This video will give you a few basics to bring you back to your farming roots! Your game screen will show your plot of land surrounded by some neighbor's farms. Using your click took, plow tool or shovel tool you can plant, delete, move and plow your plots of land. The market shows you the crops that are available to buy as well as buildings, animals and decorations too! Watch the rest of the ...
Wearing a seat belt while in a car can save your life. Do you know how to adjust and properly use it? Learn how to drive safe and use seat belts properly (Ford DSFL). A professional driver explains how to fasten your seat belt properly.
What do you know about braking in an emergency situation? If you're not even sure what kind of brakes you have on your car or truck, then you need to do some research. Learn how to drive safe and deal with emergency stops (Ford DSFL). A professional driver explains the differences between braking with Antilock Braking Systems (ABS) and standard braking systems.
Driving a vehicle is a big responsibility and road safety is paramount. Improve your driving skills by using your most important tool -- your EYES! Learn how to drive safe and always look ahead (Ford DSFL). A professional driver explains why it's important to look where you want to go, not at an obstacle, when you're driving.
When you're on the road, you want to be in control of your vehicle. The only way to be in control and improve your driving skills is by having good hand positions and correct and comfortable seating position. Learn how to drive safe with a good hand and seat position (Ford DSFL). A professional driver gives this important tip about seating position.
Mononucleosis, an infection caused by the Epstein-Barr virus, can strike anyone, but those who experience the worst symptoms are teenagers. Follow these simple steps to avoid getting this virus.
Is your child a gimme monster? Put a lid on demands and tantrums with these tips. You Will Need
Something to look out for when hunting, is small food plots that are surrounded by trees and offer a good area for things to be grown. These areas are perfect for growing certain plants that would attract deers for months and months. In this video tutorial, you'll be finding out how to use these small food plots when you're out hunting. It's easy to follow and will make life easier for you. Good luck and enjoy!
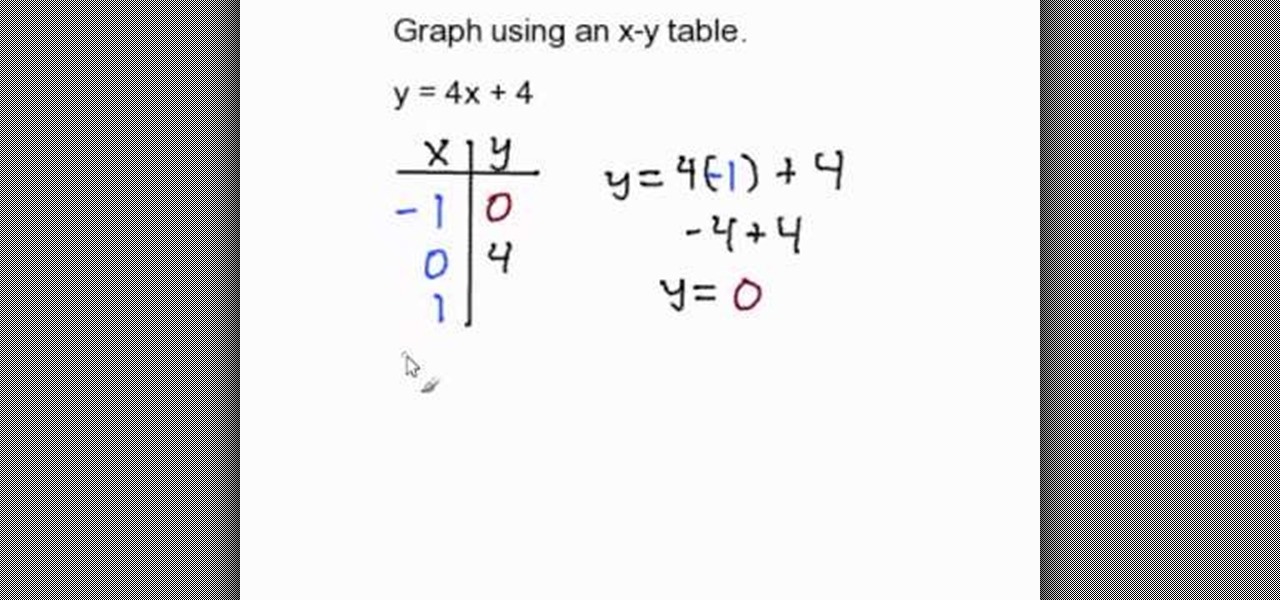
In this video the author shows how to graph using an X-Y table. He shows how to do this with a sample equation. He builds a table of x, y values where he takes sample values for x like -1, 0, 1 and now he substitutes these values in the equation of the line and obtains the corresponding y values. Now finally he has an x, y value table which now he shows how to plot it on a coordinate plane. He plots all the three pairs on the graph and connects them with a line finally obtaining the resultant...
If you use Microsoft Excel on a regular basis, odds are you work with numbers. Put those numbers to work. Statistical analysis allows you to find patterns, trends and probabilities within your data. In this MS Excel tutorial from everyone's favorite Excel guru, YouTube's ExcelsFun, the 49th installment in his "Excel Statistics" series of free video lessons, you'll learn how to find outliers with the +/- 3 Z-score rule and the ABS function. See how to do a box plot by hand and in Excel. For th...
When you begin to graph equations you will need to know how to do so in different ways. In this tutorial, learn exactly how to graph linear equations by plotting points.
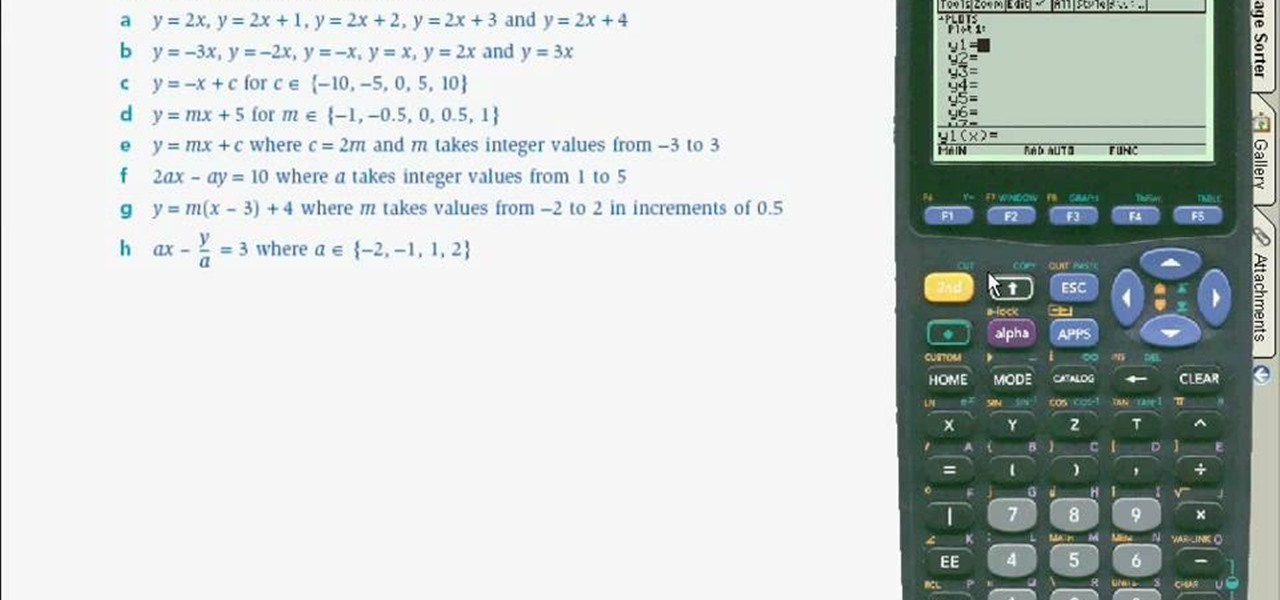
This video shows the user how to use a T189 calculator to plot linear equations. The video demonstration is done using an ‘on screen’ representation of the calculator – there are also verbal instructions. The equations are plotted on the same axis by selecting the ‘y=’ function. The corresponding values of y in terms of x are then inputted into the graphical calculator. Once this has been done for every equation you can get the calculator to display the graph. This then allows you to compare ...
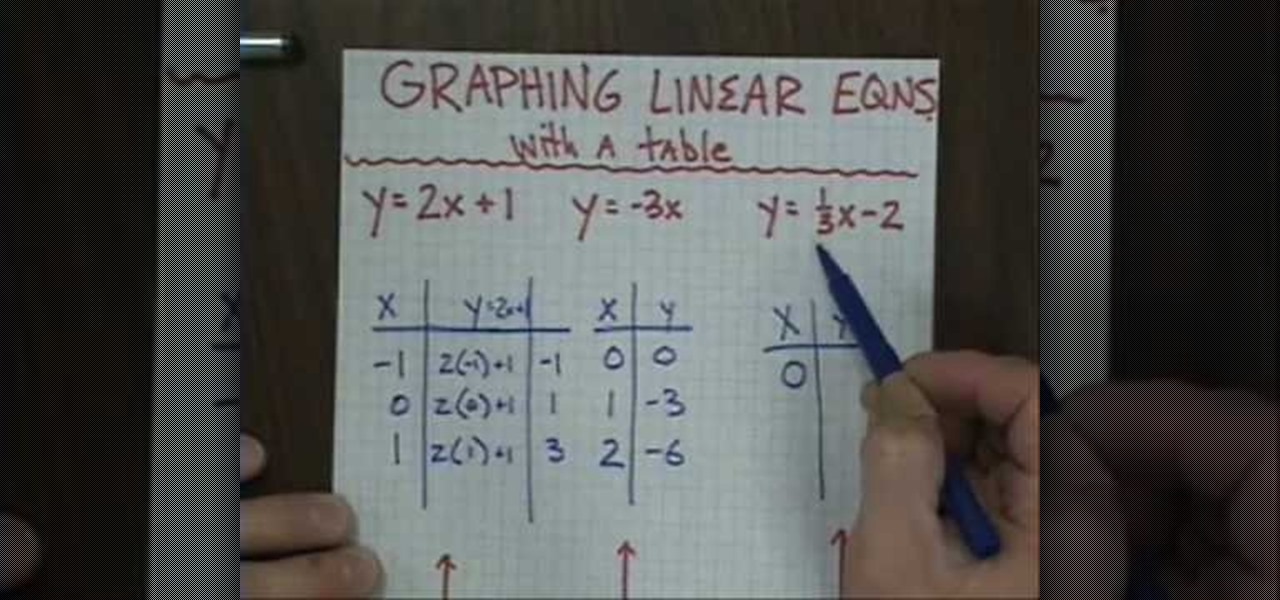
The author teaches us how to graph the linear equations with tables. Given a set of linear equations in terms of "x and y", first we have to draw a table having a column each for x and y. We have to enter an arbitrary value of x in that table and substitute that value in the given equation to get the corresponding y value. Once you obtain both x and y values, the next step is to plot them in a graph. Consider an example: in the linear equation x=2y,on substituting an arbitrary value of x=2,we...
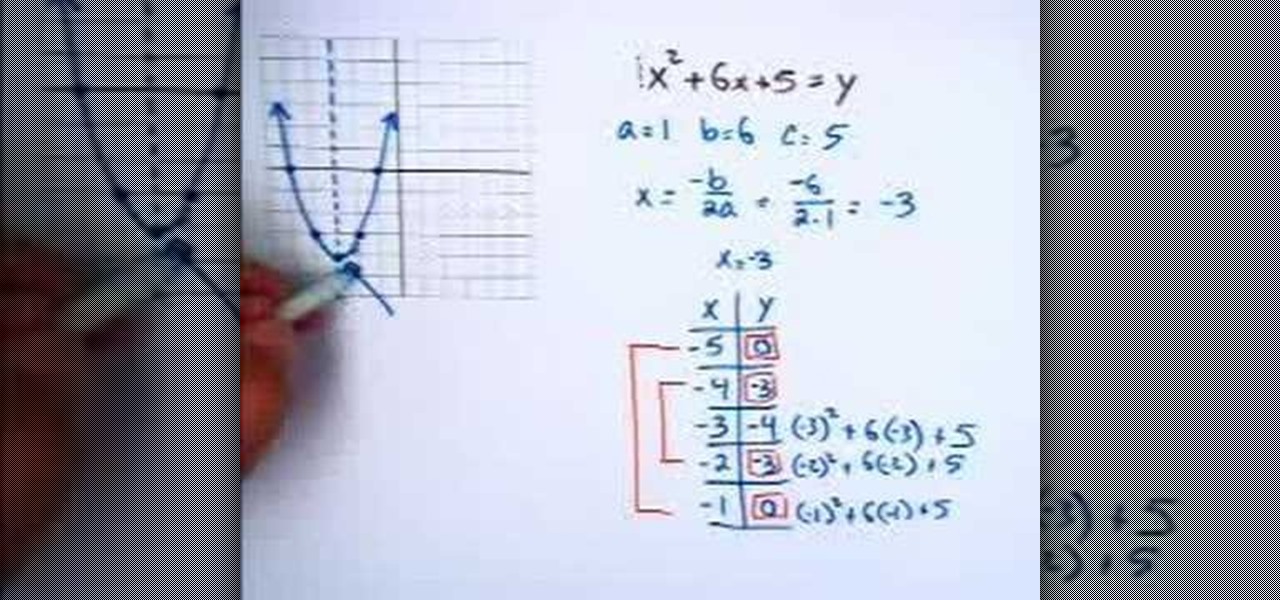
In this video, the instructor shows you how to graph quadratic equations. When you have a quadratic equation in terms of x and y, first try to identify the coefficients of the terms. Now use front end of the quadratic formula to find the line of symmetry which is the first half of the vertex using the formula x = -b/2a. This gives the line of symmetry. Next, plot the line using a few points starting at the line of symmetry. Take sample values of x and find the corresponding values of y on eit...
In this video the instructor shows how to sketch the graph of x squared and square root of x. The first equation is the x squared which is y = x * x. Now to sketch this take a sample values of x and substitute in the equation to get the value of y. Similarly find the set of points for the equation. Finally plot these points and sketch this graph which is in the form of a parabola. The curve is in the form of alphabet 'U' with its vertex at the bottom. Now similarly take the square root of x e...
This video teaches us to draw the graph of a piecewise function. This is shown using two examples. In the first example we have 'y' equal to 'x + 2' for x less than zero and '1 - x' for x greater than equal to zero. We plot two points on the function for x less than zero and do the same for the function with x greater than equal to zero. The graph for the first function is erased for x greater than equal to zero, and the same is done for the second function for x less than zero. Note that the...
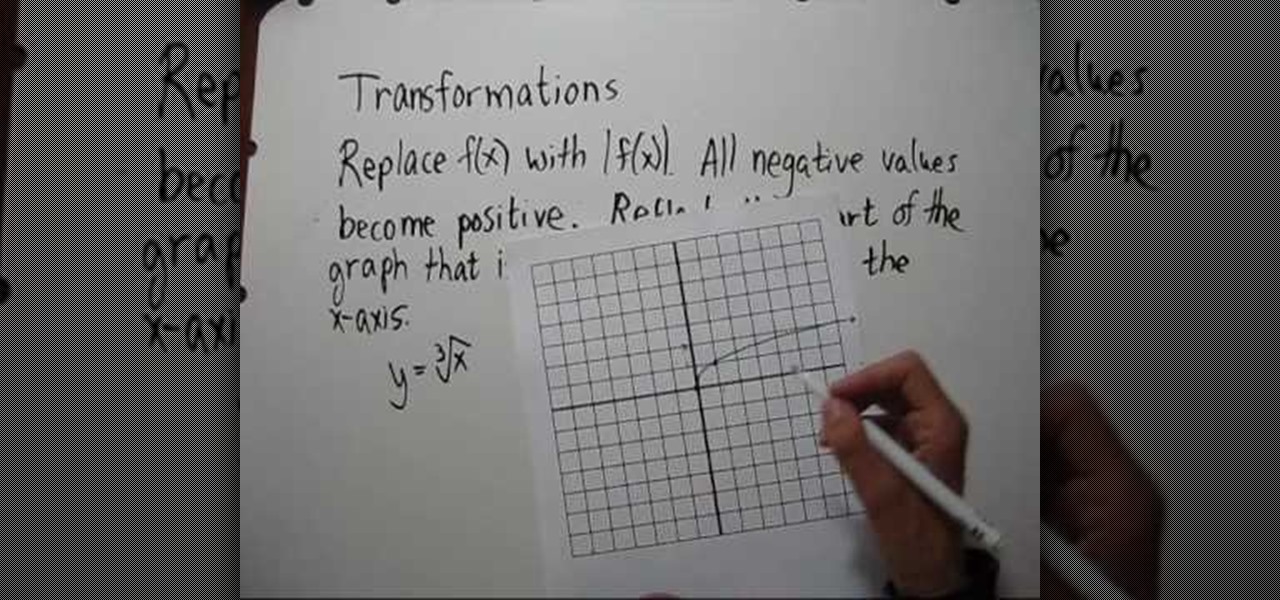
This video shows the method to plot the graph of the absolute value of a function. The video shows the example of the function of cube root of 'x'. The demonstrator first plots the graph of a cube root function. This is done by taking the reference point of positive one and positive eight. The graph is drawn for both negative and positive values of 'x'. After this the graph of absolute function is drawn by taking the absolute value of the cube root function. The resultant graph comes out to b...