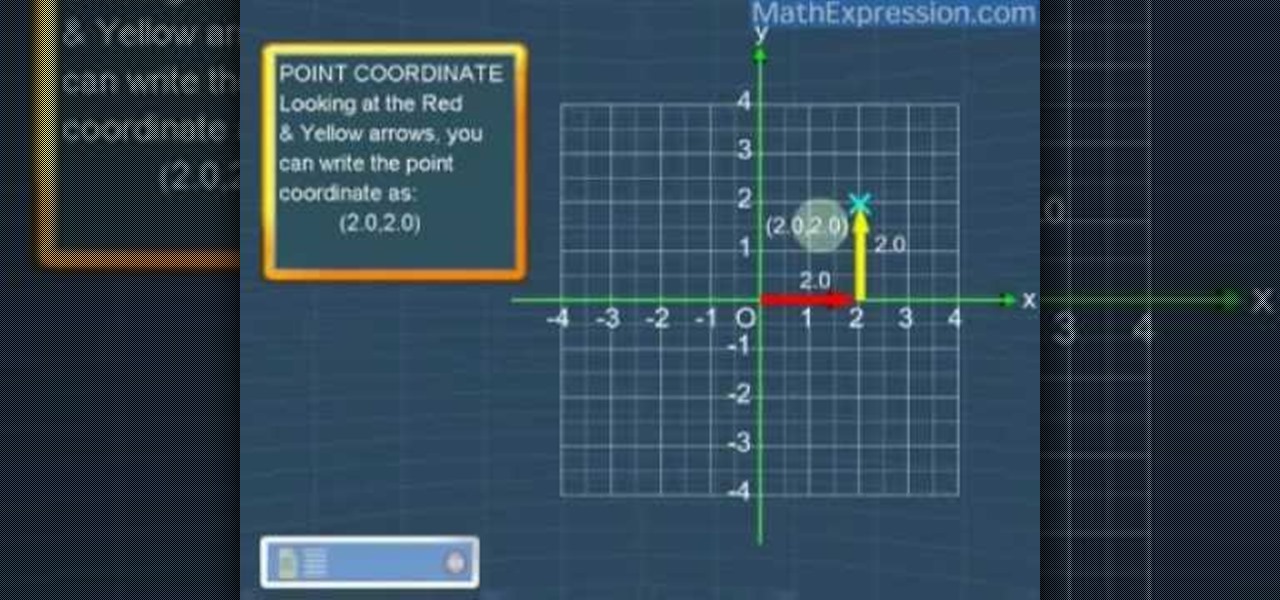
In this video the author shows how to plot a point on the coordinate plane. He explains about the coordinate plane and shows how to read and write points to it with an example. He says that any point on the coordinate plane has an x, y- coordinate values. He says that for any point its projection on the x-axis is its x-coordinate and the points projection on y-axis is its y-coordinate. He shows how to find this out for a sample value and plots the coordinates of it. In this video the author u...

In this video tutorial learn how to graph an equation using the slope and y-intercept. To show how this can be done, the equation 4X-5Y=20 is used as an example. The first step that needs to be done is to convert the equation into the y=mx+b format where m is the slope and b is the intersection of the y-intercept. Simply solve the equation for Y and you get Y=4/5X-4. From this, you will find that the slope, or m, is equal to 4/5 and that b is the coordinates 0 and -4. On the graph, you will w...

A peek inside the code of the Snapchat app has revealed that the company is expanding the search capabilities of its augmented reality camera to include visual search that may link to items within Amazon's massive online store.

Wearables were everywhere at CES 2015... you literally couldn't walk 10 feet without seeing some new and innovative device. Among the sleep, fitness, dog, and baby wearables, we came across one with a different, more important purpose—the Linx IAS injury prevention headband.

In yesterday's tidbit, we learned that across the planet women seek material wealth in their mates. This stems from our hunter-gather past in which females depended on male hunters to provide them and their children the meat necessary to support their large brains.

Earlier this month, Adam Cudworth, 19, launched a camera attached to a weather balloon into the edge of space. Battling tough winds, freezing temperatures, atmospheric pressure and tumbling speeds, the teenager from Worcestershire, England was able to capture these amazing pictures of the Earth's upper stratosphere. How to Send a Camera into Space

Helping to prove that science is way awesome, an 18-year old electrical engineering student has successfully made a light bulb float. His name is Chris Rieger, and he's been working on his "LevLight" project for about six months now, with pretty amazing results. This feat of ingenuity was accomplished by using magnetic levitation, although that over-simplification masks how considerably difficult this undertaking was.
1 Identify the child's talents, and discuss the opportunities he has to use them in productive ways. If you notice that the child you're mentoring is excellent with counting money, talk about how the child should consider a career in banking or running a business one day.
"Tron: Legacy" may have not been the most plot-driven movie out there, nor will it be an Oscar contender, but cinematography-wise it was truly a feast for the eyes. One of our favorite video game characters from the movie was Gem, one of the sirens who suit Sam up for the games.
From Ramanujan to calculus co-creator Gottfried Leibniz, many of the world's best and brightest mathematical minds have belonged to autodidacts. And, thanks to the Internet, it's easier than ever to follow in their footsteps. With this installment from Internet pedagogical superstar Salman Khan's series of free math tutorials, you'll learn how to visualize statistical data with a hand-drawn stem-and-leaf chart.
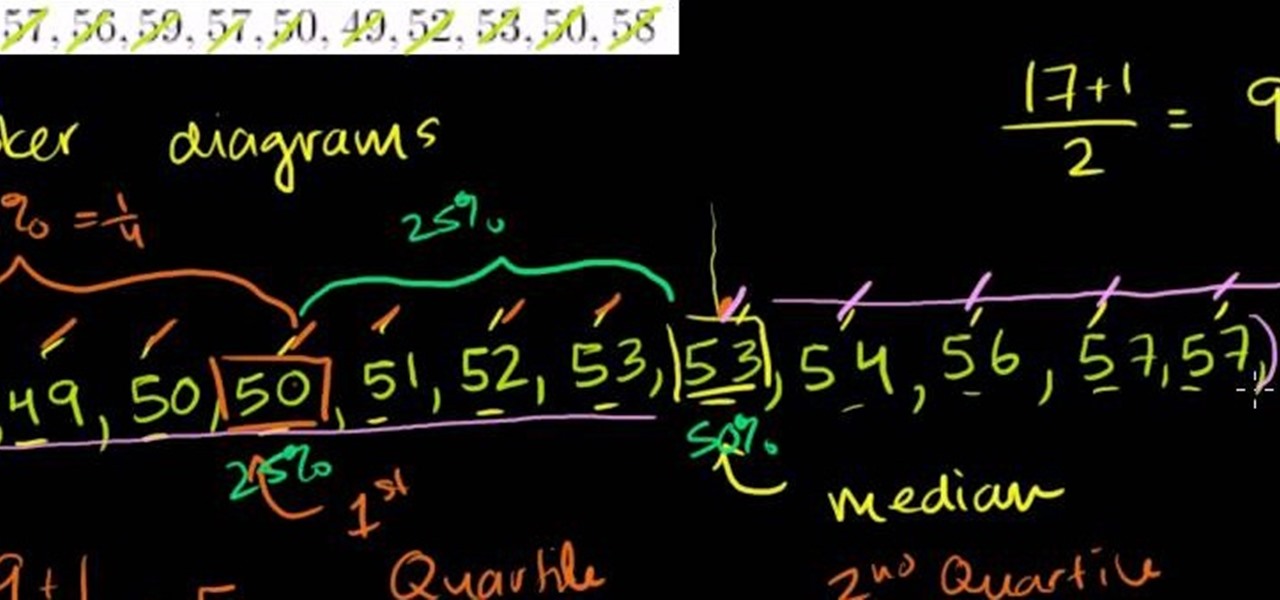
From Ramanujan to calculus co-creator Gottfried Leibniz, many of the world's best and brightest mathematical minds have belonged to autodidacts. And, thanks to the Internet, it's easier than ever to follow in their footsteps (or just study for that next big test). With this installment from Internet pedagogical superstar Salman Khan's series of free statistics tutorials, you'll learn how to use visualize data by graphing it in a box-and-whisker diagram.
Are you just a few points shy of hitting a new experience level in FarmVille, but you've run out of land to be able to plant more crops? This little cheat will let you work around this and grow more crops quickly!
If you are writing a character who is in-depth enough, you will be able to let the character out of the box and improve your writing by taking over the scene completely. Master the exercise outlined in this video and get a better grasp on both your plot and character.
The Mind Map is a technique you can use when writing your next novel, article, technical document or any other project. Create character profiles, plot arcs or design the main goal of your article by using this innovative and useful technique for organizing the information in your piece.
Get the most out of every large bag of fertilizer you can find in FarmVille! First, harvest your crops that have already been fertilized. Then, replant the empty plots. Finally, spread the fertilizer across the growing plants on your farm!
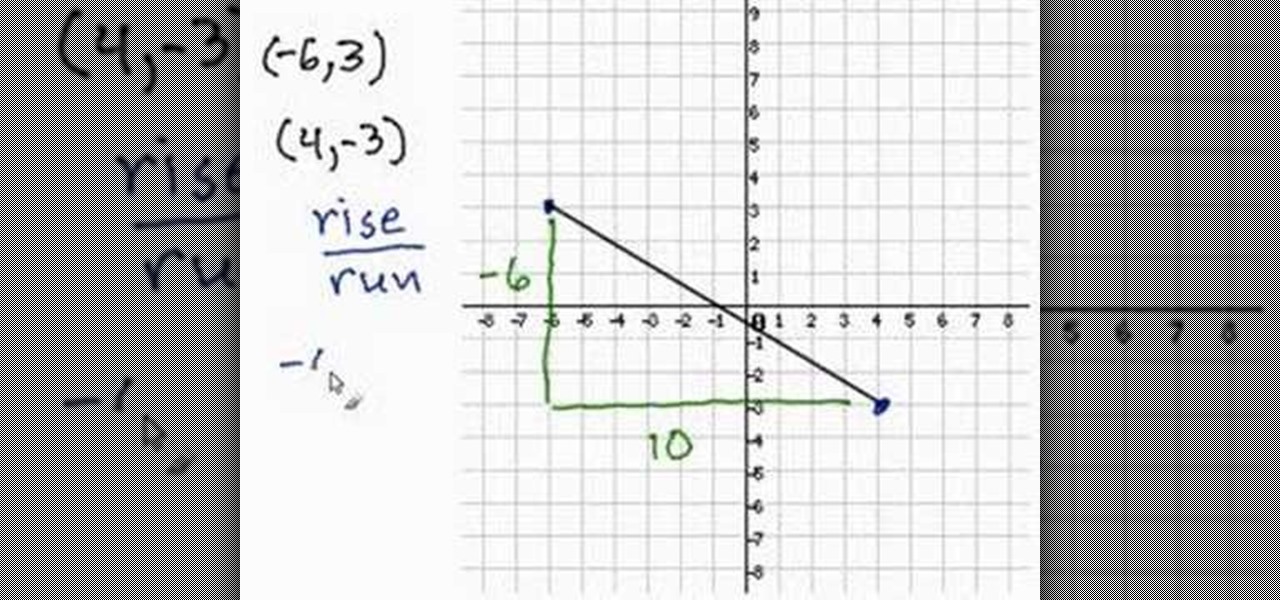
This tutorial will show you how to determine the slope of a line if you are given two coordinates on a coordinate plane. You should first find the location of each point on the plane, remembering that the coordinates are in the format of x-axis (or horizontal movement), followed by y-axis (vertical movement). After plotting both these points, you should draw a straight line between these two points and then determine the slope of this line by taking the rise over the run of the line.
Heidi Hewett demos AutoCAD 2009 and shows you how to use the Quick Access Toolbar. The Quick Acces Toolbar starts in the top right corner of the AutoCAD 2009 interface and contains the most common tools like new, open, save, plot, redo and undo. Learn how to use the quick access toolbar and how to customize the toolbar to include the tools you use most in AutoCAD 2009.
You want to have a tomato garden and you bought the seedlings already... now what? Watch this video tutorial to learn how to properly transplant your potted tomato seedling into your garden plot.
Do you have a boyfriend or girlfriend that is just too clingy and obsessive? Then watch this how to video as these teen girls show you how to avoid clingers. They may be teenagers but their advice extends beyond the teen age years.
This instructional video provides basic tips on proper baseball hitting fundamentals. Specifically, in this tutorial you'll learn how to hit line drives to the pull side by using the tee. Whether you are a parent who is excited about getting your youngster or youngsters started out in t-ball, a teenager trying to improve your skills or even a college or professional player, these hitting basics hold true regardless of what skill level you are at.
This instructional video provides basic tips on proper baseball hitting fundamentals. Whether you are a parent who is excited about getting your youngster or youngsters started out in t-ball, a teenager trying to improve your skills or even a college or professional player, these hitting basics hold true regardless of what skill level you are at.
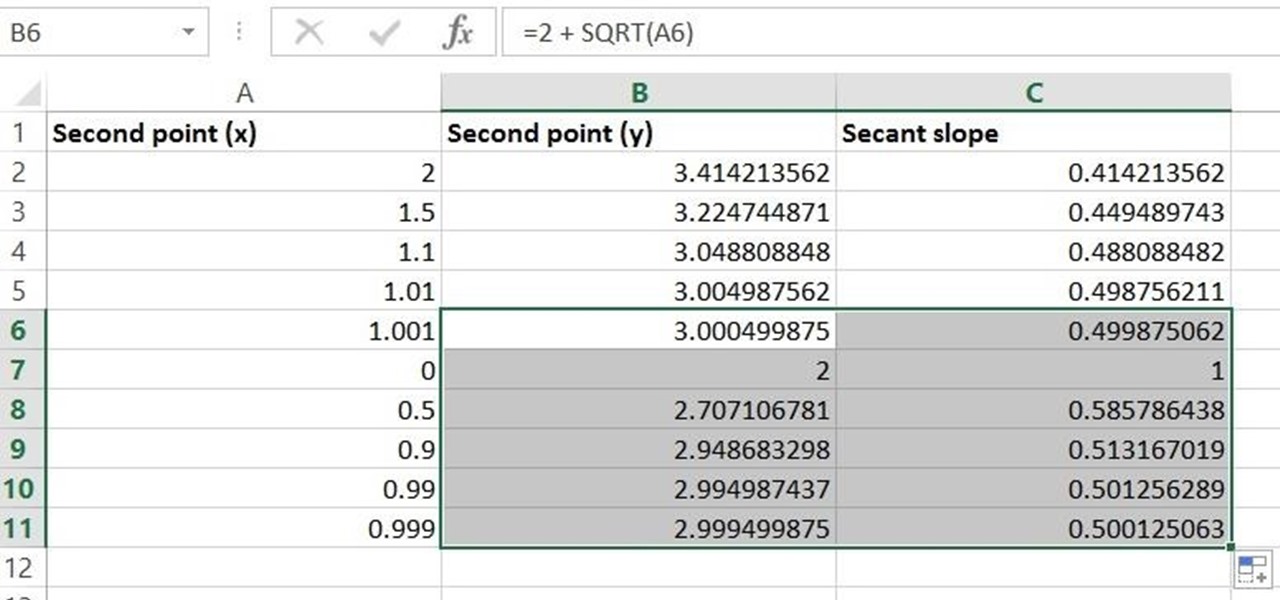
Given a function, you can easily find the slope of a tangent line using Microsoft Excel to do the dirty work. That is to say, you can input your x-value, create a couple of formulas, and have Excel calculate the secant value of the tangent slope. This is a fantastic tool for Stewart Calculus sections 2.1 and 2.2.
This video tells you how to draft an equation in point-slope form. Consider the equation (y+4) = 2(x+7) for example. The formula for the point-slope form is (y-y1) = m(x-x1). To plot the graph you have to identify m the slope, the x intercept x1 and the y intercept y1. In this equation the slope is 2 and (x1,y1). The x intercept according to the formula is -x1 but the given value is +7 so you have to figure out what will give you +7,only -(-7) can give you +7 so the point is -7 and now the y ...
If this is your first novel or you want to make a better one then this video will give you good advice on how to write fiction character for a great novel. The animated animals and people in this video will give you some great advice to improve your novel.
We're addicted to "True Blood." And, if we're going to be honest here, it's not just because the show has labyrinthine plot lines and exciting vampire vs. human vs. werewolf action. With hot chicks and hot guys, the show seems to be a breeding ground of good looks. And we're not complaining.
New to Microsoft Excel? Looking for a tip? How about a tip so mind-blowingly useful as to qualify as a magic trick? You're in luck. In this MS Excel tutorial from ExcelIsFun, the 351st installment in their series of digital spreadsheet magic tricks, you'll learn how to create an area chart for x and f(x) data as well as how to use the IF function to show a second data set plotted to show a specific area section.
A basis of algebra, slope intercept form can easily bring your equation to a graph with ease. This video will show you exactly how to graph equations using the slope intercept form.
Calculus can be a bit tricky, but don't worry, Watch Math is here to help you out. Watch this math video lesson to learn how to solve quadratic inequalities in calculus. There's no better way to learn mathematics than from an advanced mathematician, like this PhD.
After achieving viral and financial success with its Gender Swap and Baby Face camera filters, Snapchat has returned with the augmented reality equivalent of Benjamin Button.
When the titular hero of your superhero movie activates his powers with a catchphrase, it would be pretty neat if your augmented reality promotion for that film could react to the user's voice.
As a kid, there was nothing more fulfilling than sinking my teeth deep into the succulent flesh of an orange, savoring every drop of juice that wasn't busy sliding down your chin and onto your clothes. While my adulation for oranges never ceased as I grew older, the way I consumed the precious fruit did evolve with my maturity. Gone were the days of messy eating, and here I was now, peeling my oranges as a teenager, taking my precious time in separating each individual slice for a clean and t...
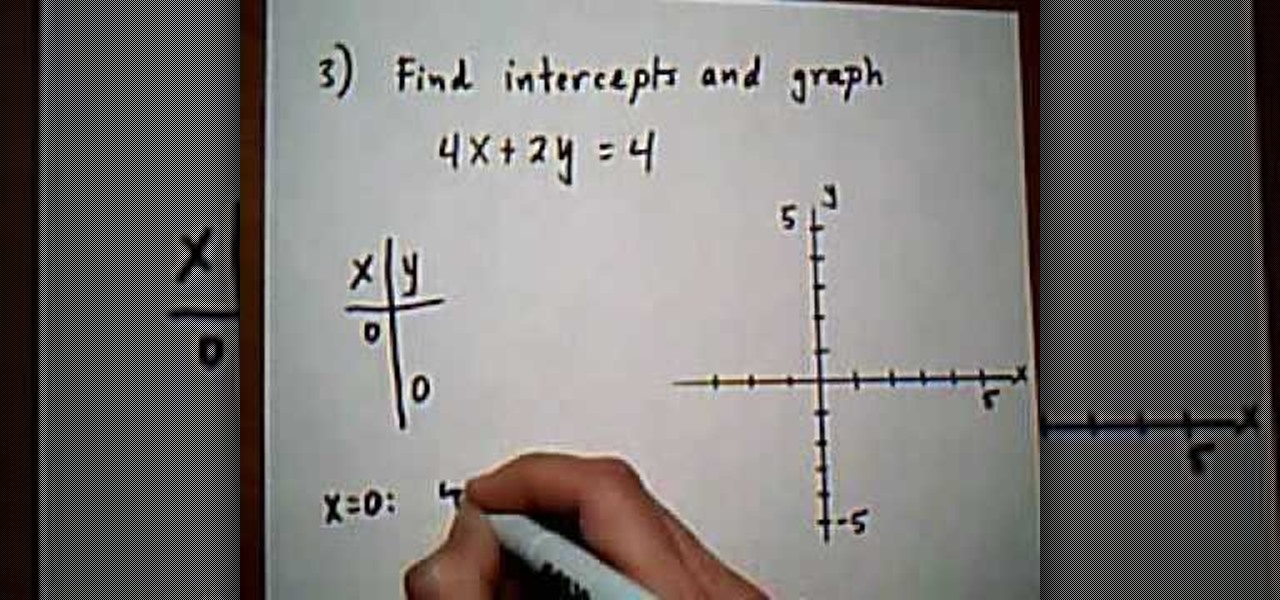
The first question asks for the intercepts x and y. To find X, you would need to set Y to zero, leaving the equation 3X=6. X then equals 2 after you divide both sides by 3. The X intercept that you found is not just the value of 2, but it is the ordered pair X=2 and Y=0 on a graph. To find Y, you would do the same thing, except this time X would be set to 0. In the second example of this video tutorial, you will actually learn how to graph the X and Y intercepts. To do that, you follow the st...
Turning over your soil mixes the nutrients and makes the ground more suitable for planting. Watch this video to learn how to turn over soil.
This video teaches how to plow without rows in Facebook's Flash game Farm Town. It is easiest to start at the top corner of your farm. Notice, put your cursor on the green highlight (or JUST below) of the plot. Then click left mouse button hold down and BARELY drag up and toward the plot to the left. It is tricky at first but after a field or two it is easy. This will DOUBLE the amount of crops you can plant on your farm.
The discriminate of any equation in any degree plays an important role in determining the roots of that equation.
Plangere Culture Lab demonstrates how to use the opacity feature in Final Cut Pro. The opacity feature is a beneficial tool to use when working with layers. Opacity is an attribute which relates to how much you can see through a clip. To layer clips, create a new video track on the timeline. Make sure that the source tab is in the right position. The track on the top of the stack is the dominant track and will be shown. Select the volume and opacity overlay button. Click on the line over the ...
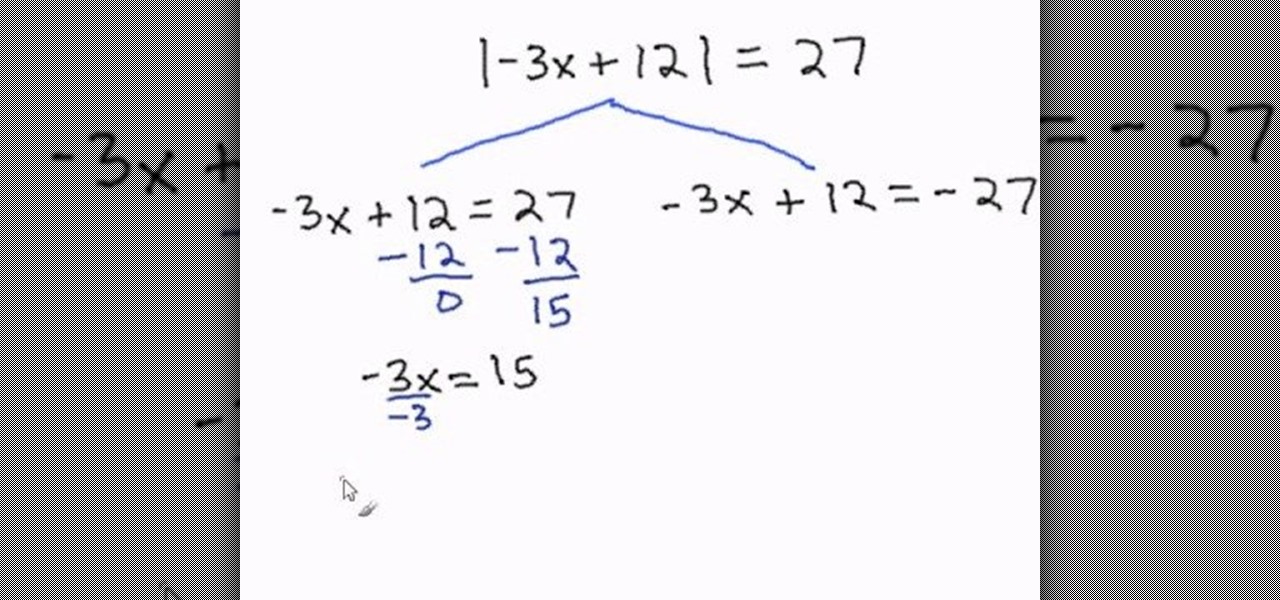
This educational math video describes the steps necessary to solve an equation involving absolute values. "Absolute value" refers to the magnitude of a quantity and is always expressed as a positive number. You can think of absolute value as the distance a number would be from zero if plotted on a number line. Positive 17 and negative 17 both have the same absolute value because both are 17 units from zero on a number line. Because of this, all absolute value problems have two answers, one wh...
In this tutorial the instructor shows how to graph a parabola and also how to find its roots which are also known as zeroes. He gives the quadratic formula of how to find x-intercepts of a parabola. He takes an example and substitutes the values and finds out the values of the roots of the parabola. Now he substitutes these values in the equation to obtain the corresponding y coordinates. Now using these pairs of values he plots the parabola on a graph and draws it. This video shows how to fi...
This is an interesting mathematical instructional video on how to make a quartile diagram. This example is about 34 grades obtained by chemistry class students. We need a minimum value, a maximum value, Q1, Q2 and Q3 values to make a quartile diagram. The minimum is 43 and the maximum is 92. To calculate Q2 median formula (n+1 over 2)is used. The Q2 median is 17.5. So the average of 69 and 71 is 70 and hence Q2 70. Similarly Q1 is calculated as 61 and Q3 is calculated as 79. Now you can draw ...
Written and illustrated by Masashi Kishimoto, "Naturo" is an ongoing Japanese manga series. The plot tells the story of a young ninja named Naruto Uzumaki, who constantly searches for recognition & aspires to become the ninja in his village that is acknowledged as the leader and the strongest of all, also called a Hokage. The series is based on a one-shot comic by Kishimoto that was published in the August 1997 issue of Akamaru Jump and has since grown into a phenonmenon.