Mike Lively of Northern Kentucky University demonstrates how to create a 3D plotting program for the sinc math function. Part 1 shows how to convert a Flash Package into a Flex application. Part 2 shows how to get the sinc function running and add different textures. Create a cool interactive 3D plotter in thie Adobe Flex Builder 3 and Papervision3D tutorial.

What makes a good movie good is that it is both aesthetically pleasing and has an interesting point/plot. This video runs you through how to make it visually effective, stressing how you frame and compose a shot. While the Rule of Thirds is forever a great way to make shots interesting, there are other ways you can set up a shot.
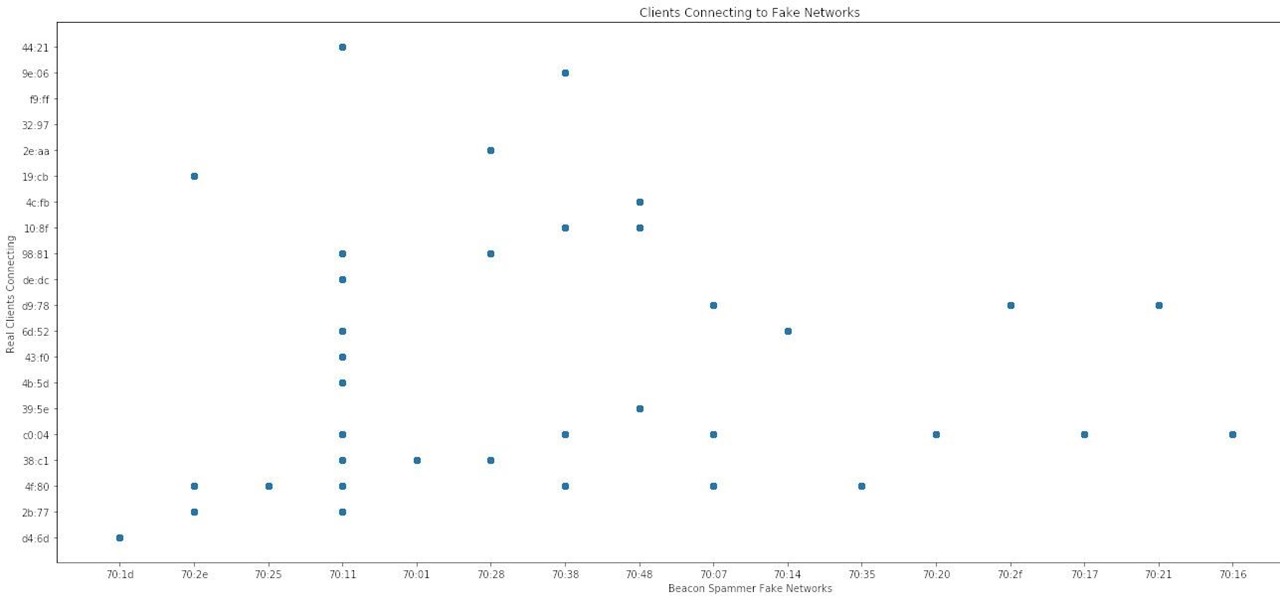
With the Wigle WiFi app running on an Android phone, a hacker can discover and map any nearby network, including those created by printers and other insecure devices. The default tools to analyze the resulting data can fall short of what a hacker needs, but by importing wardriving data into Jupyter Notebook, we can map all Wi-Fi devices we encounter and slice through the data with ease.

If you're lucky enough to have a large backyard, or perhaps even a plot of land, then you probably have several trees on hand. If for whatever reason one or two of these trees needs to be cut down, don't just dispose of the wood!
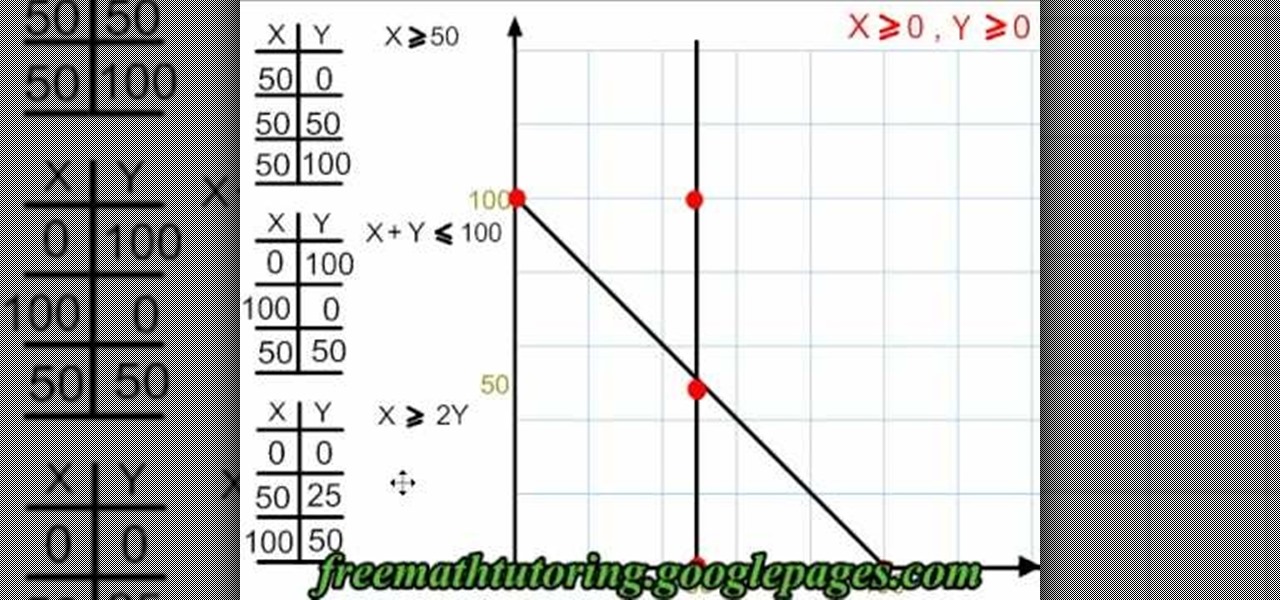
This video shows us how to graph & shade a polygon of constraints. Start out by finding the non zero constraints and the other constraints and inequalities. You will need to know how to graph before you begin to do this equation. Look at the first constraint and then fill in the X and Y sign in your table. Continue on to do this for the other two constraints that you have. Once you have these written down and in front of you, it's just a matter of graphing. Start to graph with the given coord...

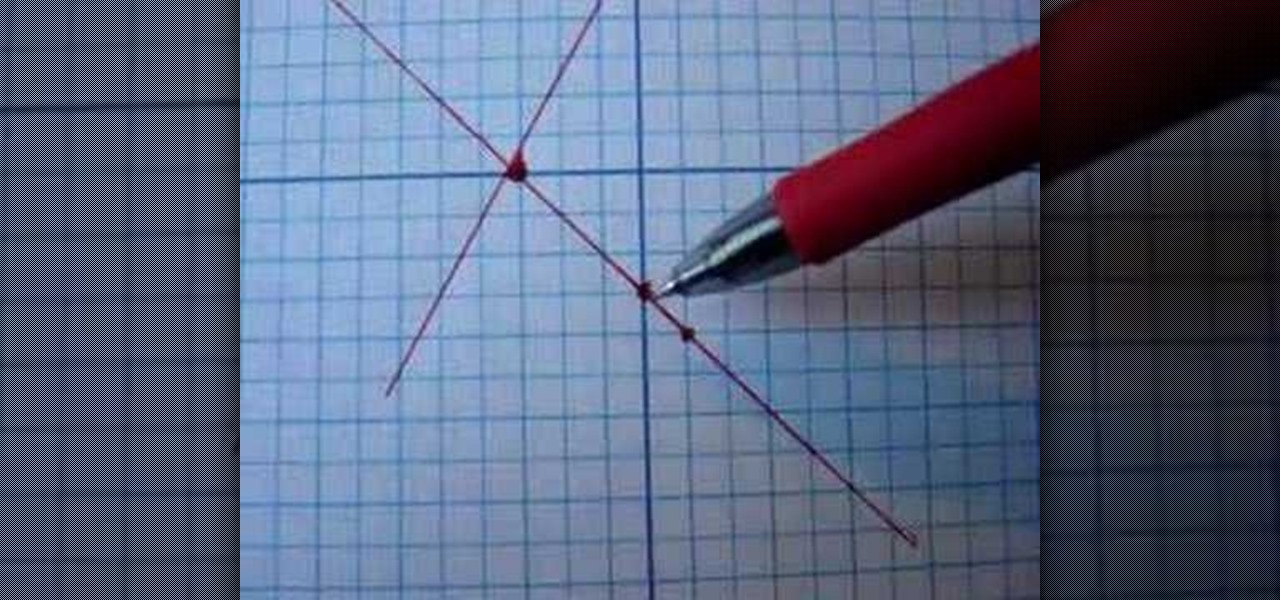
In this tutorial, we learn how to find the area of a triangle given three points. First, you will need to plot the points on a graph. After this, find the base and the height using the graph. Next substitute into area of a triangle formula and then evaluate. When you finally find the area of the triangle, then you will write down the answer ending it with the units. This is a simple way to find the area of the triangle, you just have to make sure you count correctly and have calculated the ar...

Great! You've finished your masterpiece of a module ready for play in Dragon Age! You've got quests and characters and plot twists and all sorts of other good stuff! But...how do you play it? If you're not sure what to do, check out this video. In this video you will learn how to export a basic module into the main game so you can play it, or share it with other users!
Spidey finally finds the location of where Scorpion was planning on taking his fragment, a high tech building in the city. And to his surprise, he finally finds the mastermind behind the whole plot: Doctor Octopus, or Doc Ock, or Sa- oh who cares what her real name is? She's gone mad with delusions of power thanks to her discoveries with the shard and she's planning to the take over the world (craaaaaaazzzzyyyyyyy). In this video you will get a full walkthrough for chapter 11 of Spider-Man: S...
Solving the Inequalities using graph, first you have to take the inequality equation into equal. Then convert the equation into straight line equation i-e(y=mx+c). Giving own values for 'x' like (-1, 0, 1) we would get the value for 'y'. By plotting these points in the graph, you will get an straight line. If the given equation is greater than symbol, shade towards the positive part. If the given equation is smaller than symbol, shade towards the negative part. This is an one method to solvin...
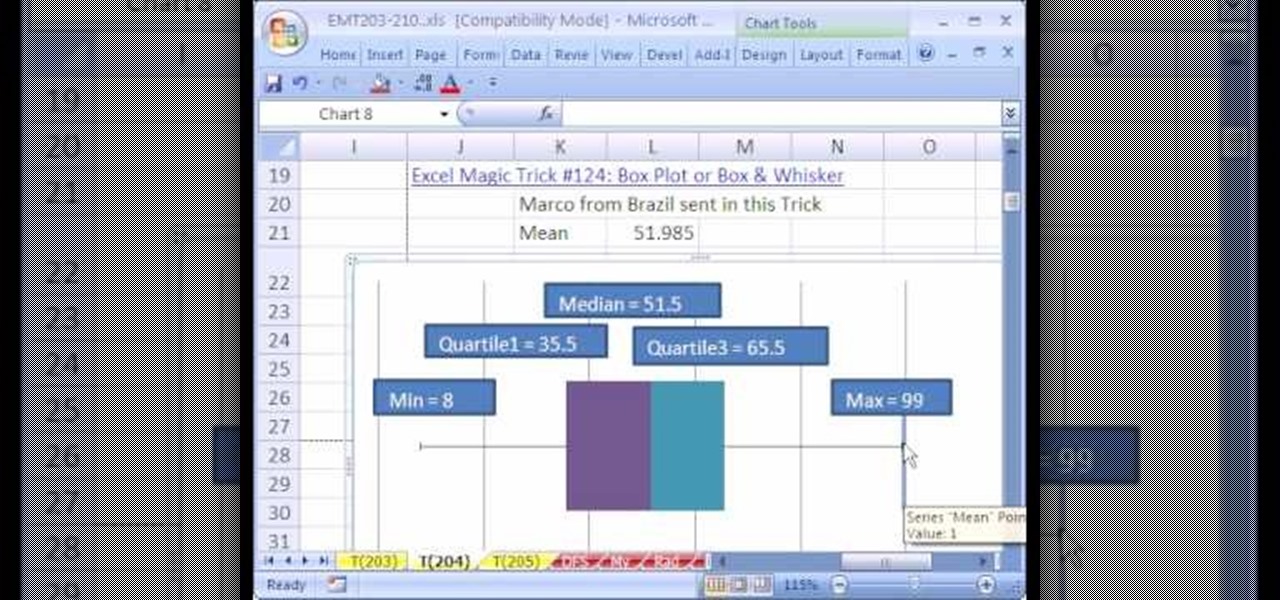
New to Microsoft Excel? Looking for a tip? How about a tip so mind-blowingly useful as to qualify as a magic trick? You're in luck. In this MS Excel tutorial from ExcelIsFun, the 204th installment in their series of digital spreadsheet magic tricks, you'll learn how to add a mean value as a scatter diagram data series to a box plot or box & whisker that is set up as a bar chart.
This video shows the viewer how to solve simultaneous equations using a graph or ‘graphing’ as it is referred to. This is done by first rearranging both equations so that y is the object of both equations. The equations can then be solved via substitution – the video does not cover this. Using graphing the next step is to plot both of the lines onto the graph. This can be done by substituting varying values of x to give the y co-ordinates. The solution to the linear equation should be the poi...
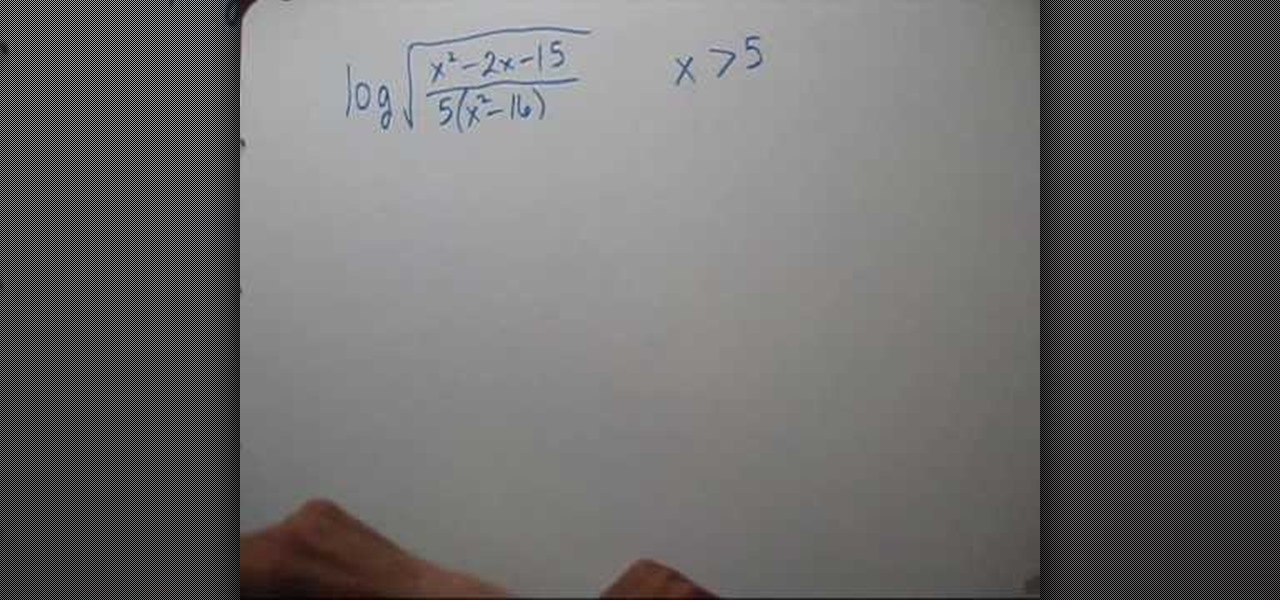
This video shows the method to write a logarithm as a sum or difference of logarithms. The square root of the term given is taken out as half according to the rule. Then the numerator and denominator is divided into product of factors. This is broken into the difference of numerator and denominator according to the rule. Finally, the product of factors is expressed as the sum of factors. Now we see the domain of the term. As the term is a square root of the term it should be greater than zero...
In this video tutorial, viewers learn how to graph a linear equation. The linear equations example used in this video is y= 1/3x-3. The equation to graph a linear equation is y= mx+b. Now substitute each number into the equation. Therefore, m= 1/3 and b= -3. Begin by graphing the Y-intercept. M is the slope and b is the y-intercept. Plot the y-intercept on the -3 axis. Then move up once and to the side 3 times. This video will benefit those viewers who are struggling with this math unit and a...
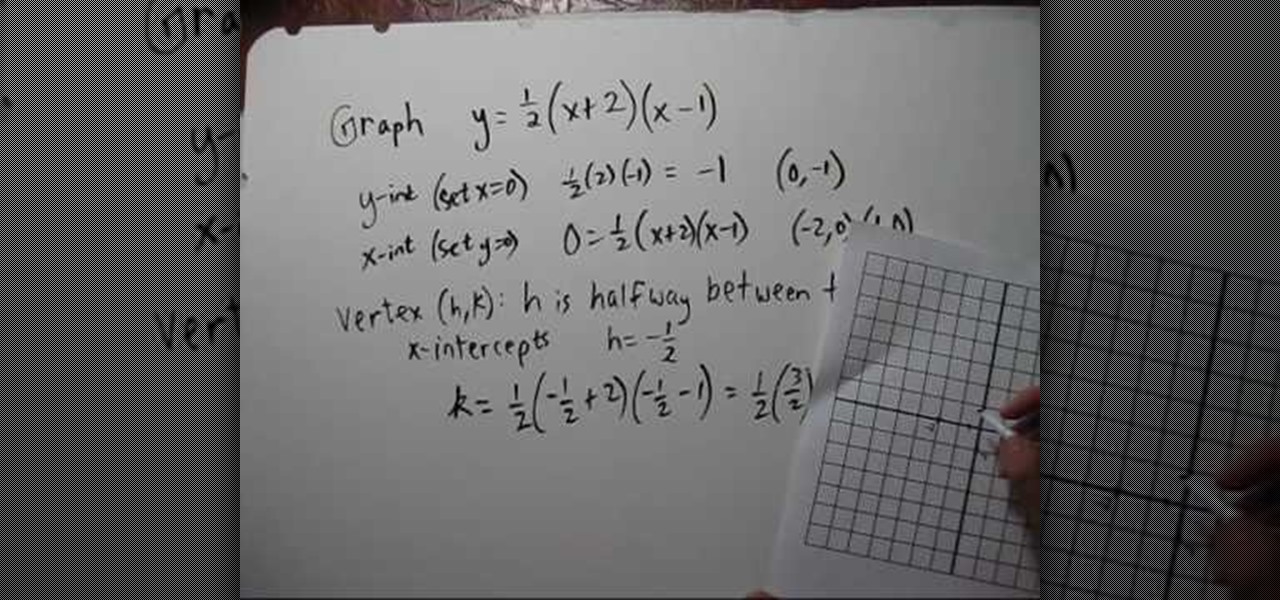
This video deals with solving quadratic functions. It does not involve the use of the quadratic equation; rather, only factored equations are used. The speaker starts out with a factored quadratic equation. The speaker goes on to do the mathematical steps necessary to find both the x and y intercepts of the quadratic function at hand. The author then continues on with the example to find the function's minimum. Next all of the points that have been solved for are plotted and the function is s...
This video shows the method to graph a linear function by finding the X and Y intercept. Only two points are needed to graph linear functions. So we find the point on Y axis or the Y intercept and the point on the X axis or the X intercept. We notice that on the Y axis the X coordinate is zero. So, we find the Y intercept by putting x=0 in the given equation and solving for y. In the same way, we find the X intercept by putting y=0 in the given equation and solve for x. We join the two points...
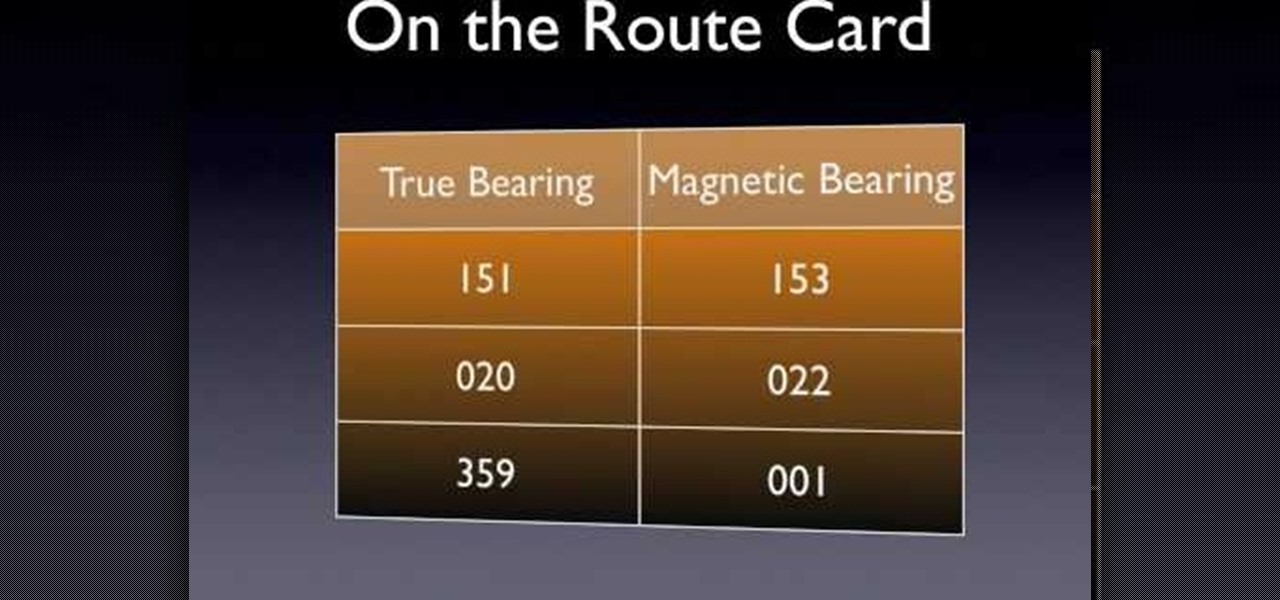
Without good navigational skills, your expedition could lead to failure or result in a dangerous situation. Try to use a laminated map which is better in wet conditions. 1:25,000 scale maps provide the greatest detail. One grid square equals 1 kilometer. Use map keys for reference. Don't mistake boundary walls for footpaths. A compass points to magnetic north and the top of the planet is called true north. Magnetic north is constantly moving and its position relative to true north is differen...
This video shows us how to draw a linear equation using the slope and intercept technique. First, the narrator explains how to simplify the equation in order to get the slope and intercept out. He then shows how the coefficient of x equals the slope and the constant term tells us the y position of the intercept point. The technique for drawing the final line is plotting the intercept at the right height on the y axis, then running for some distance along the x axis and rising some amount. Thi...
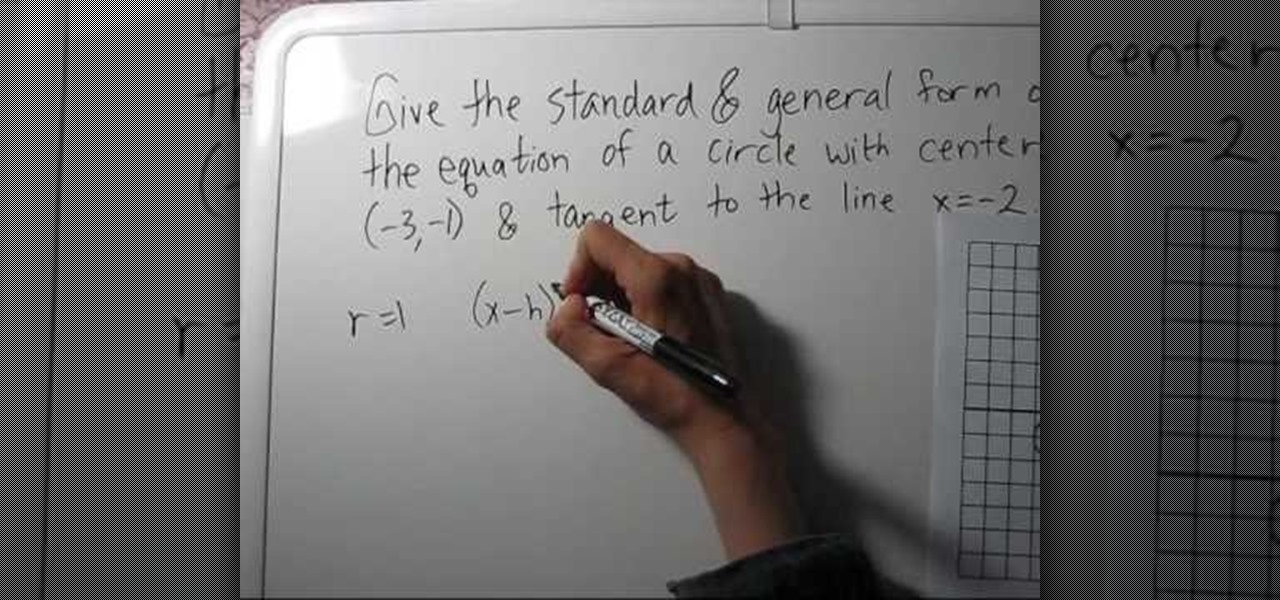
In this video, the instructor shows how to find the equation of a circle given its center point and a tangent line to it. To do this, take a graph and plot the given point and the tangent on that graph. Now, from the center of the circle, measure the perpendicular distance to the tangent line. This gives us the radius of the circle. Using the center point and the radius, you can find the equation of the circle using the general circle formula (x-h)*(x-h) + (y-k)*(y-k) = r*r, where (h,k) is th...
When you are solving inequality for a rational function you don't do it the same way as you would solve an equality. Now the instructor shows how to solve an inequality with the help of an example. Now to solve an inequality which is in the form a/b first take the numerator and denominator as separate equations of two lines. Now graph the two lines on coordinate axes. Using the graphs of the lines plot the intercepts of the equations on the number line noting down the sings. Now you can compa...
This video shows you how to graph an equation in standard form. In easy to understand instructions, you will learn how to find the x and y intercepts in order to put those two points on a graph, creating a line. Finding the intercepts is as easy as plugging in zero and solving for either x or y. This creates an ordered pair, which can then be graphed. The points are plotted easily on a Cartesian plane, which completes the problem.
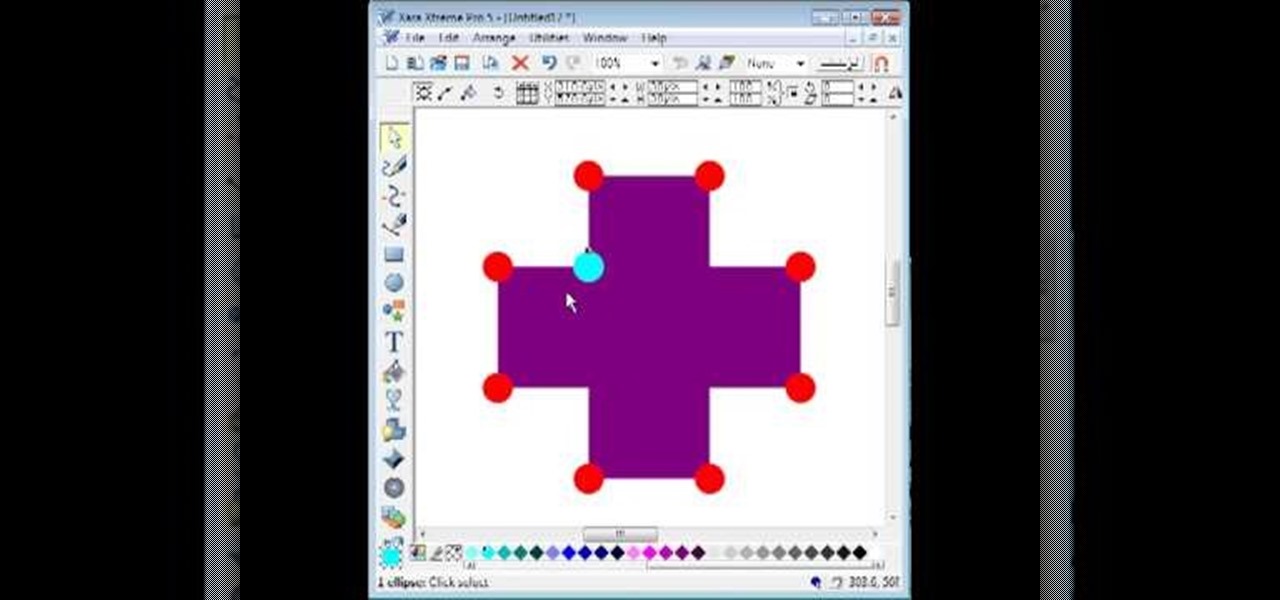
By utilizing the click and drag features of Xara Xtreme, users can take shapes and duplicate them for quick work (ctrl K). Further by identifying them by colors and other subsets, users can add or delete with just a button push, or (use the add shapes, subtract shapes options.) All this is done in the event for the sake of convenience; eliminating the tediousness of creating shapes one by one, and using them as plot points on a map to create projects within record times.
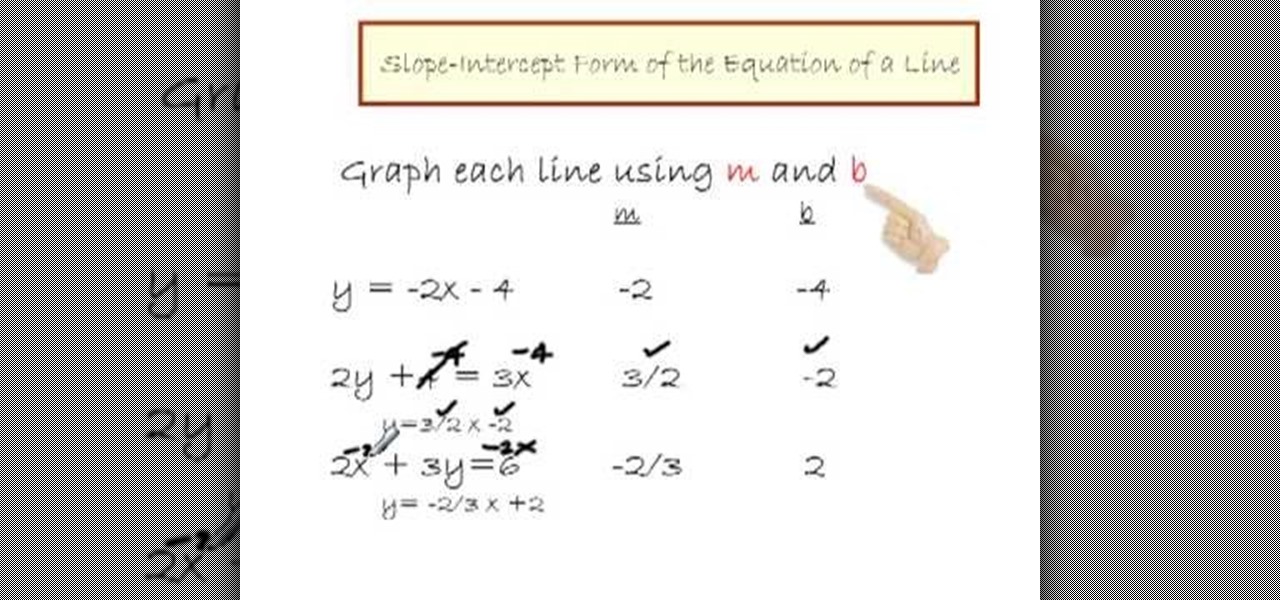
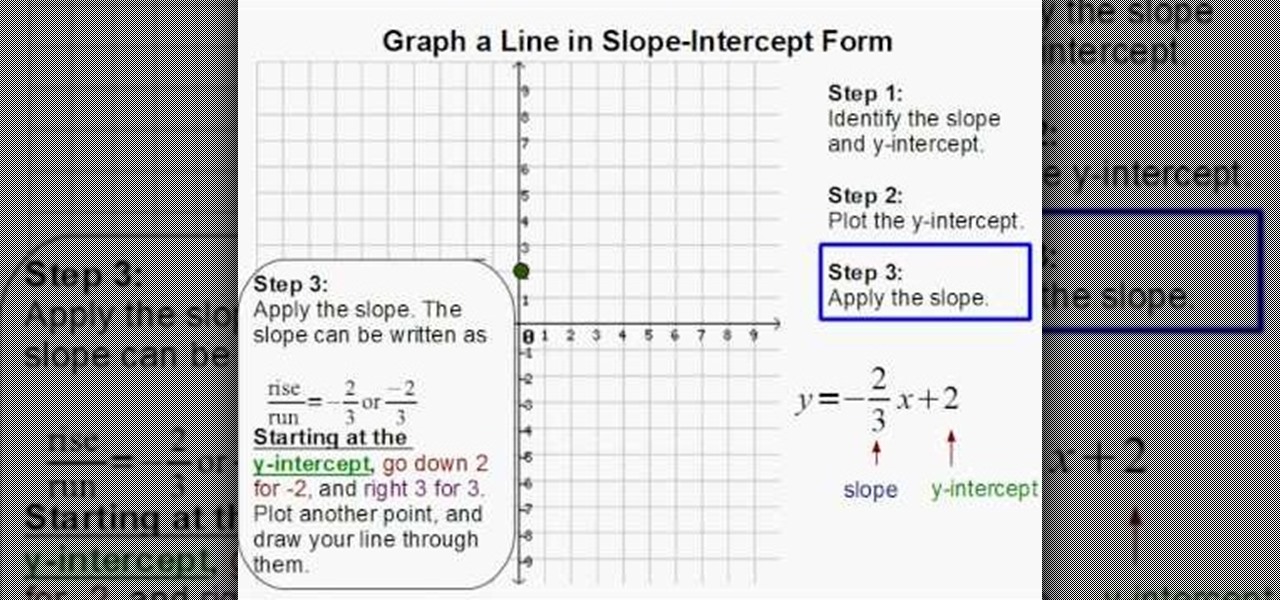
Graphing a line in slope-intercept form is easy in simple after watching this video. In this math tutorial, you'll be guided step-by-step how to graph a line from an equation in the y=mx+b format. The steps include determining the slope and the y-intercept, plotting the y-intercept on the graph, and finally applying the slope to connect the points. The video guides you through the entire process by illustrating and demonstrating all the necessary steps, thus making graphing a snap.
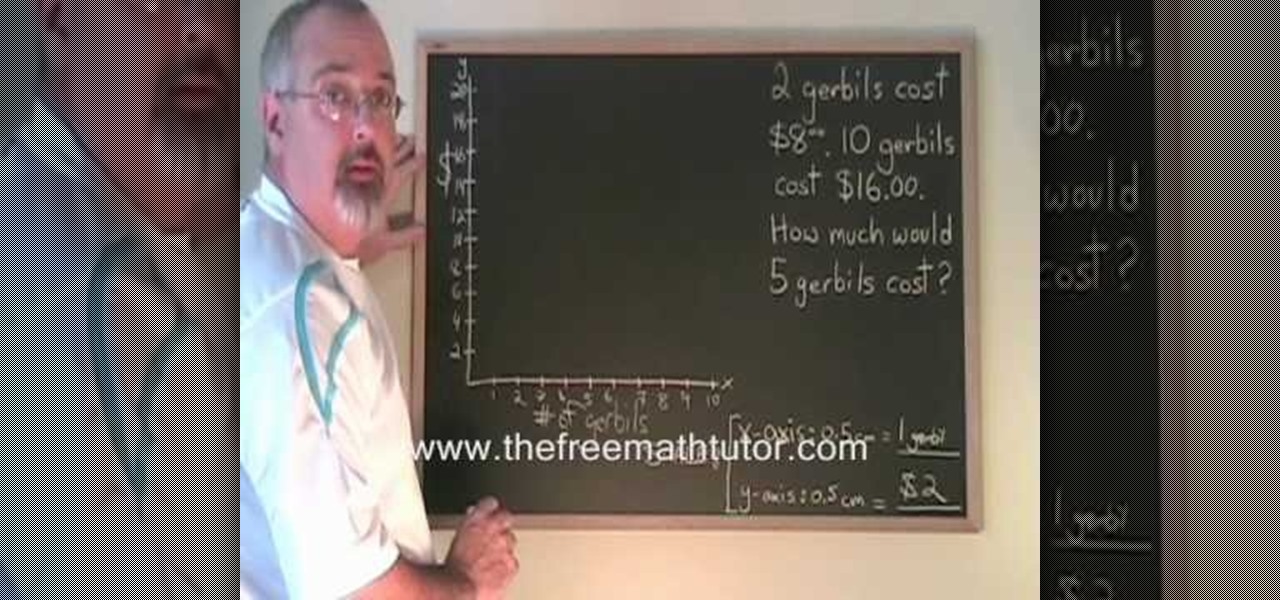
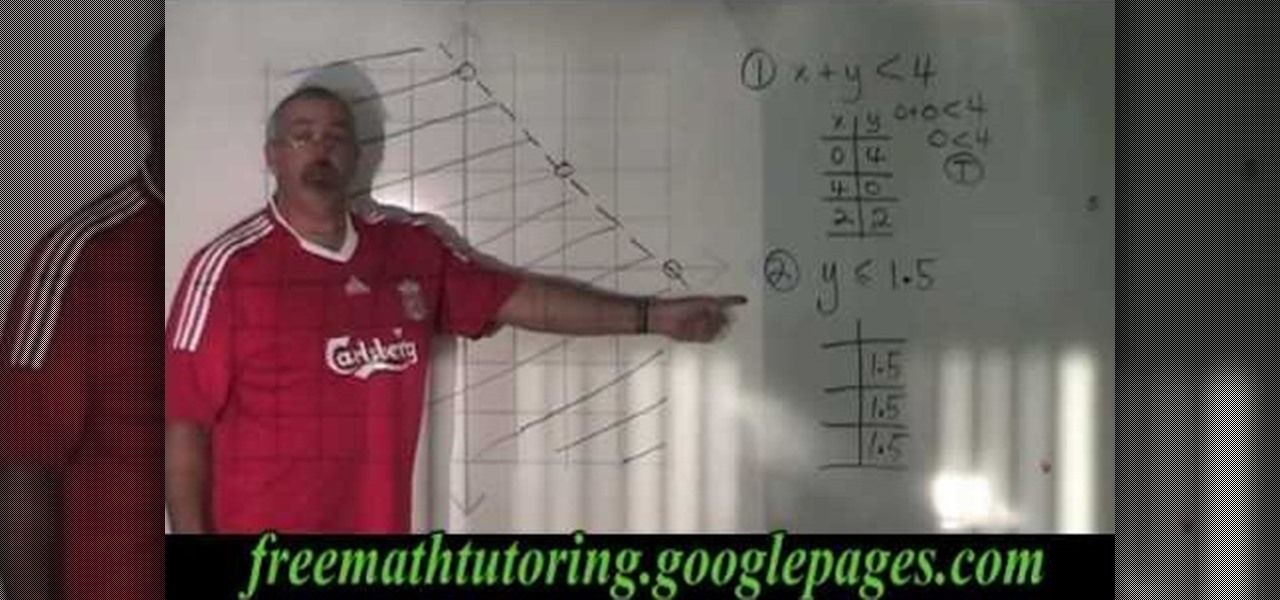
A video from The Free Math Tutor that shows you how to use graphs to solve simple linear algebraically problems in mathematics. This video is introductory in nature and teaches the viewer, proper plotting methods on graphs. The presenter also teaches you how to choose a proper scale for solving such problems. The first section of the video is about choosing a proper scale for the graph while the second section deals with solving the problem in a step wise and easy to understand way.
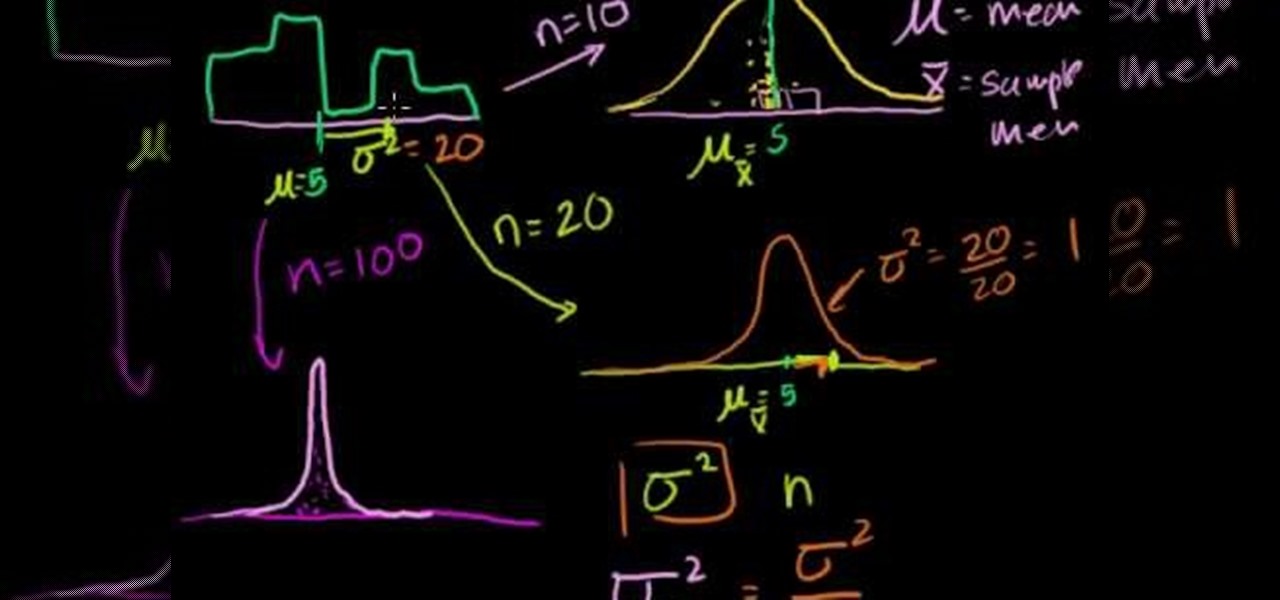
In this video the tutor explains about the standard error of the mean. He starts explaining by drawing the diagram of a distribution and now he takes ten samples from the distribution and starts plotting them. He says that in theory if we do it infinite times then we can obtain the sampling distribution of the sampling mean. For the example he takes the number of samples as 10. Now depending on these values of n we can get different sampling distributions. Now he intends to find the mean of t...
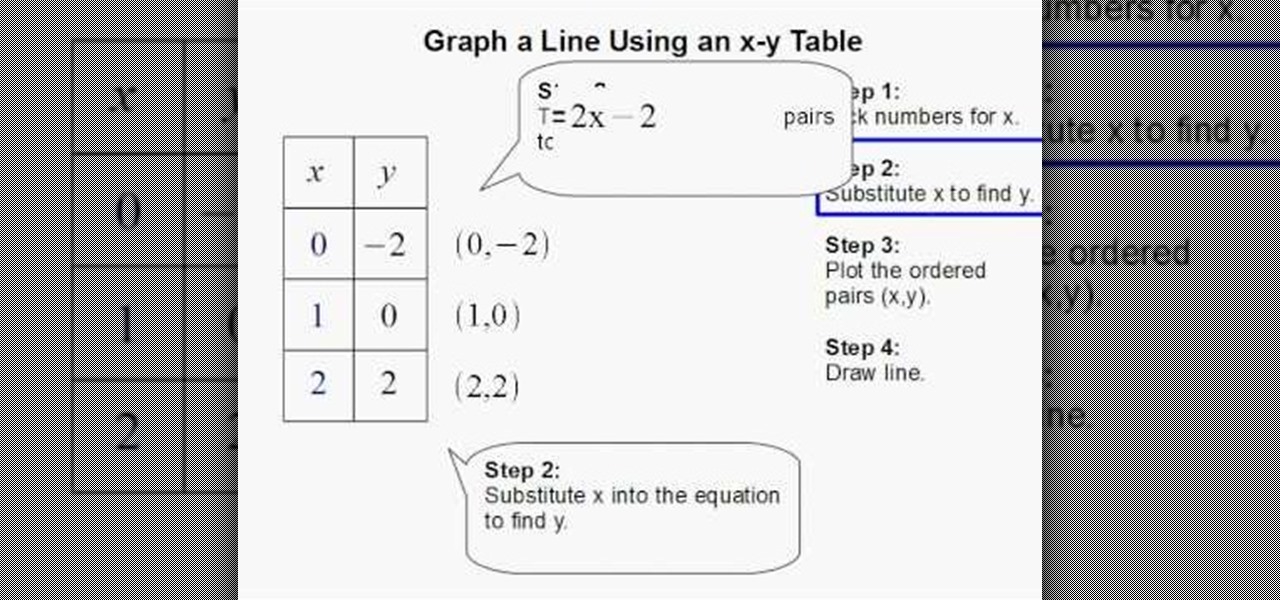
In this video the instructor shows how to graph a line using X-Y table values. He specifies a four step approach. In the first step he picks numbers for the value of x. In the next step he substitutes the values of x in the equation of the line to obtain the corresponding y values, in the third step he plots these ordered pairs on a graph sheet. Finally in the fourth step he joins them resulting in a straight line for the given equation. This video clearly shows how to graph a line using an X...
In this video the instructor shows how to shade a system of inequalities. He says that shading a system of inequalities is similar to shading a single inequality but in the former case you tend to shade more than one inequality in the same graph. He shows how to do that using an example set of inequalities and plots the lines on the graph. He uses dotted lines for lesser than or greater than inequalities and uses straight lines for inequalities which contains the equal to symbol. Now he shade...
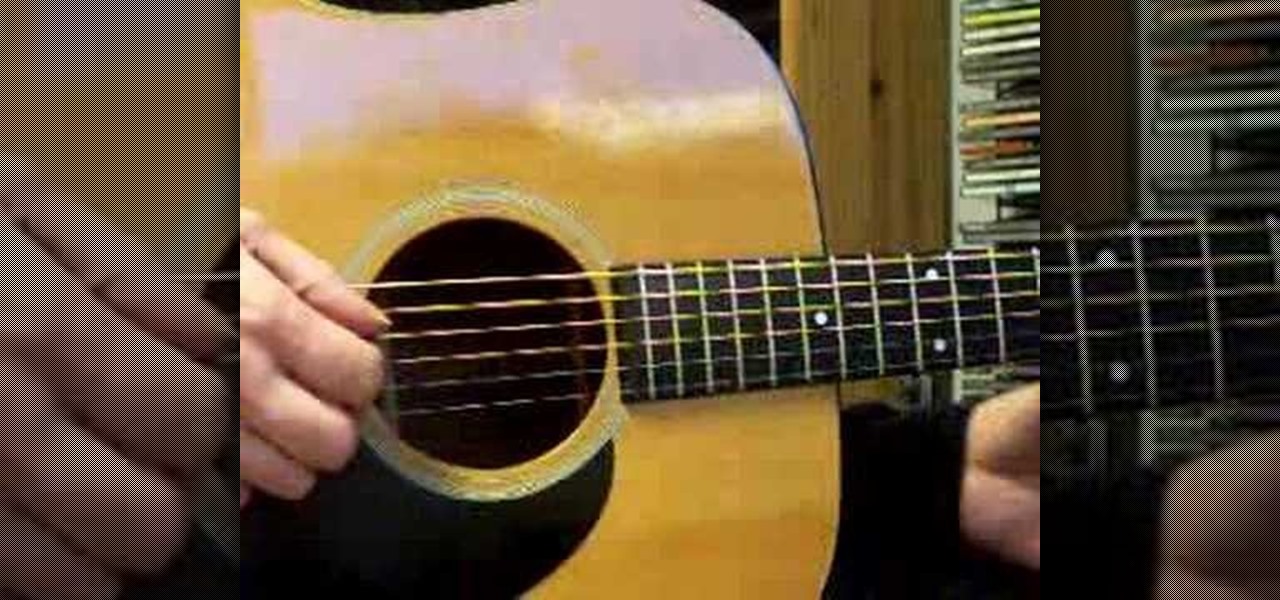
Check out this instructional acoustic guitar video that provides a short lesson looking at quarter notes, straight eighth notes, swing eighth notes and eighth note triplets. Play quarter notes with the metronome. Metronomes are good for helping to play in time, learning to listen, and plotting your progress to keep track of speed. The power of the metronome is undervalued, but start with this exercise to practice. Improve your guitar playing skills by watching this short tutorial video to lea...
The camera shake method of filming is used in many popular TV shows including 'The Office,' 'Glee,' and 'Modern Family.' Typically the camera shake - or a wobbly, unstable frame - contributes a sense of urgency, unease, and interest to a shot, making it more dynamic and unpredictable. Quite like the plot of the shows mentioned above.
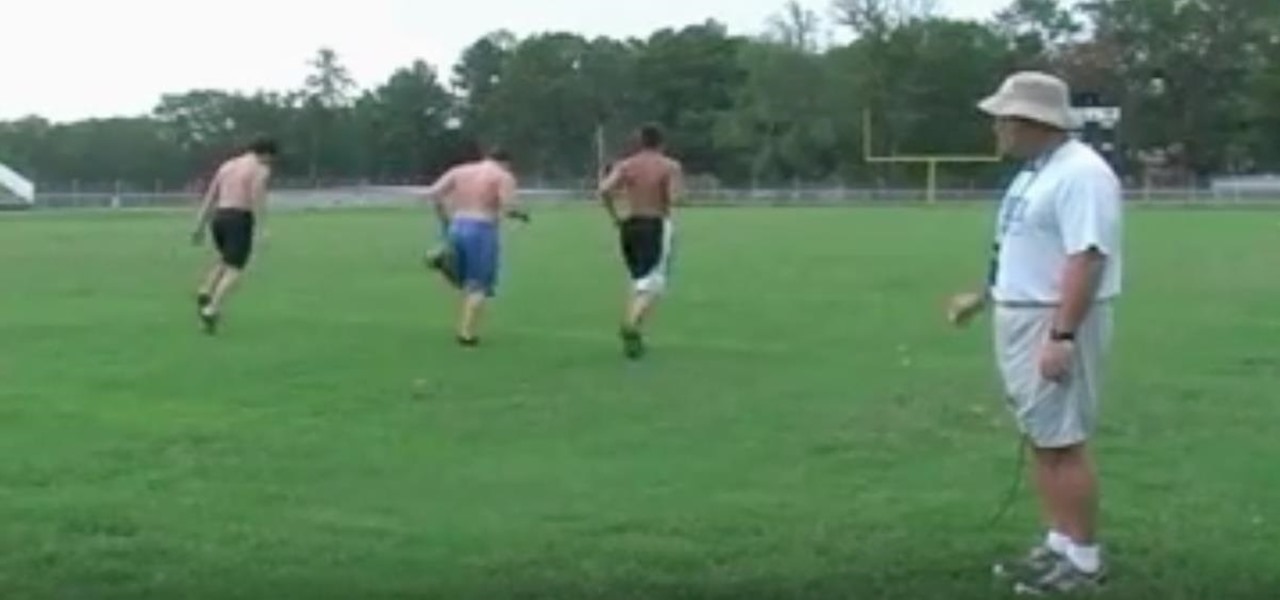
If you're a pee wee coach, you know that coaching kids is a tough job. Children can even be more difficult to work with than adults, but it's the best time to shape them into a great sportsman… and to get faster!
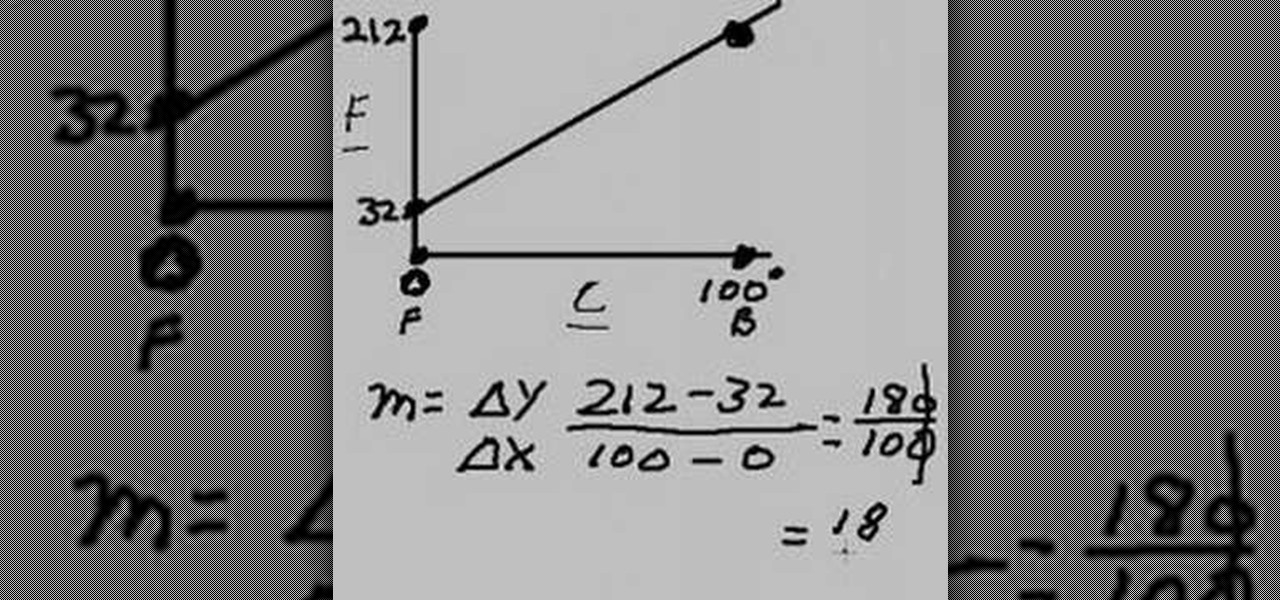
The video teaches how to convert degrees Celsius to degrees Fahrenheit. First the boiling points of 32 degrees Fahrenheit and 100 degrees Celsius are plotted on the Y and X axis. Then a line is drawn to join them both. The value m is delta Y (boiling point minus freezing point, i.e., 212-32)/ delta X (boiling point minus freezing point, i.e., 100-0). So m works out to 180/100 or 1.8. Then the formula y=mx+b (intercept of y = 32) is used, substituting X with Celsius and y with Fahrenheit, to c...
Welcome back, my hacker apprentices! In recent weeks, the revelation that the NSA has been spying on all of us has many people up in arms. I guess I take it all in stride as I just assume that the NSA is spying on all of us—all of the time. Don't get me wrong, I don't condone it, but I know the NSA.
When it comes to sniffing Wi-Fi, Wireshark is cross-platform and capable of capturing vast amounts of data. Making sense of that data is another task entirely. That's where Jupyter Notebook comes in. It can help analyze Wi-Fi packets and determine which networks a particular phone has connected to before, giving us insight into the identity of the owner.
The 15-year-old star of the 1980s-inspired hit series Stranger Things, Millie Bobby Brown, may have (spoiler alert) lost all her powers as the character "Eleven," but in the real world, she still has augmented reality in her arsenal.
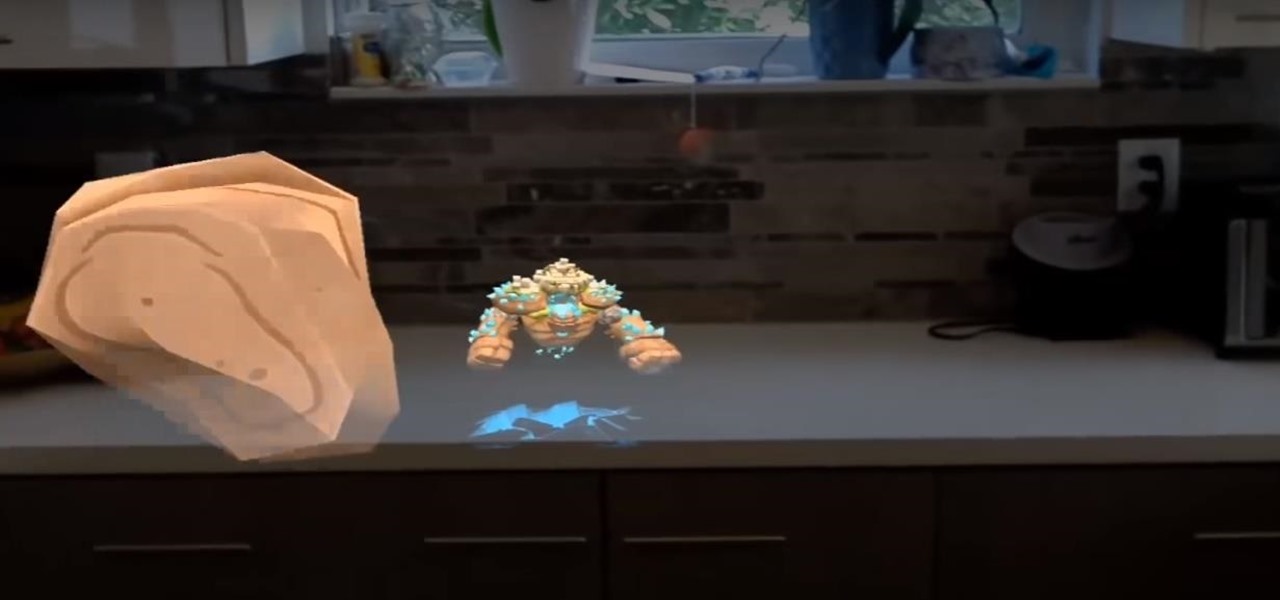
As it prepares to ship its first product by the end of the summer, Magic Leap has managed to impress yet another high-profile investor in telecommunications giant AT&T.
Usually, we think of vaccines as preventative, a shot we get to prevent the flu or some childhood disease like measles or mumps. But there are vaccines for other purposes, such as the ones studied by researchers from the Netherlands.
The internet's an amazing place. The entirety of human knowledge is now accessible in an instant, and all sorts of media can be streamed directly to the palm of your hand. But, of course, that also includes the darker side of humanity, so there's plenty of NSFW content floating around out there that's certainly not suitable for children.
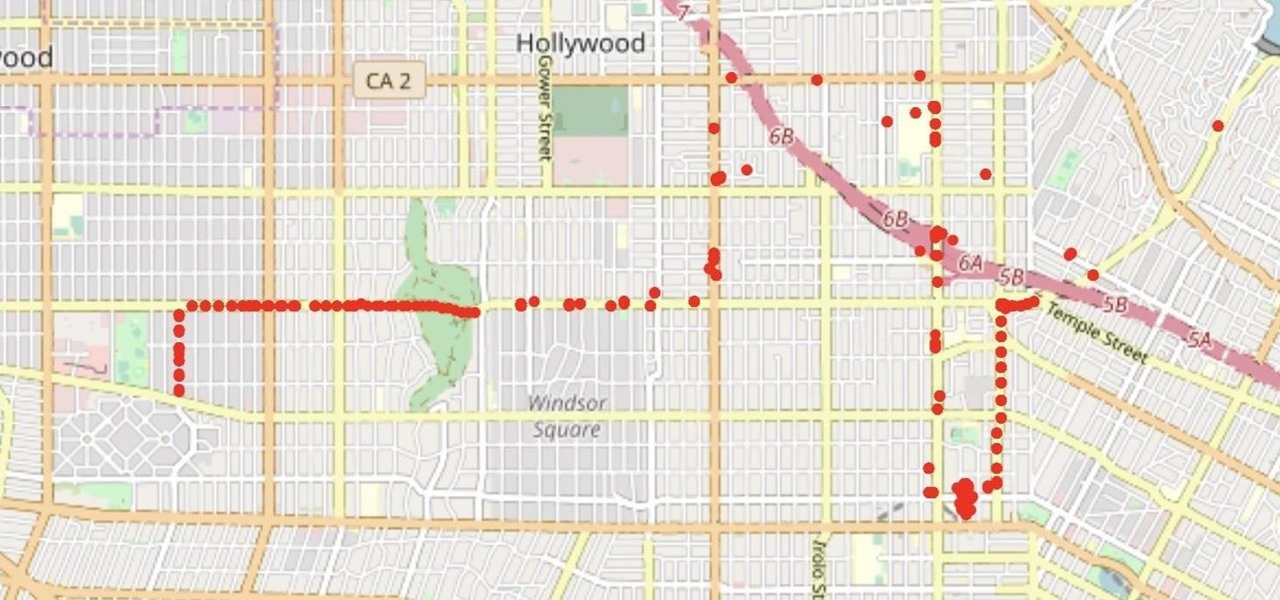
With an Android device left at its default settings, your location history is automatically recorded. You can view and manage this data, but the simple interface of points plotted on a map leaves a lot to be desired.
Instagram is not only a great platform to easily share some of your favorite moments with friends and family, it's a useful service for peering outside of your physical location. While you share a picture of your dog in Los Angeles, you can almost instantly view and like a picture someone posted of their breakfast in Tokyo.
Hey everyone, freakje118 here! This week, the first challenge ever will be to build an awesome and icy ice castle! It can be any size you want but please use the plots. Let your imagination work and make something great of it! you can use any blocks that you want! Ice, water, quartz, wool,.... But remember, it should be an ice castle!
There wouldn't be any chaos in the world without Benoit Mandelbort— chaos theory, that is. Mandelbrot, who just passed away at the age of 85, pioneered fractal geometry and greatly influenced chaos theory. He spent most of his life working in physics, biology and astronomy, and is best known for his Mandelbrot Set, a mathematical set of points in the complex plane (the boundary of which forms a fractal).