SoundCloud is a really interesting alternative to Spotify and Pandora in that it will never really give you the exact mainstream song that you want. If you're looking for new up-and-coming artists that are making some wonderful alternative remixes to mainstream music, then SoundCloud is the right music streaming app for you.
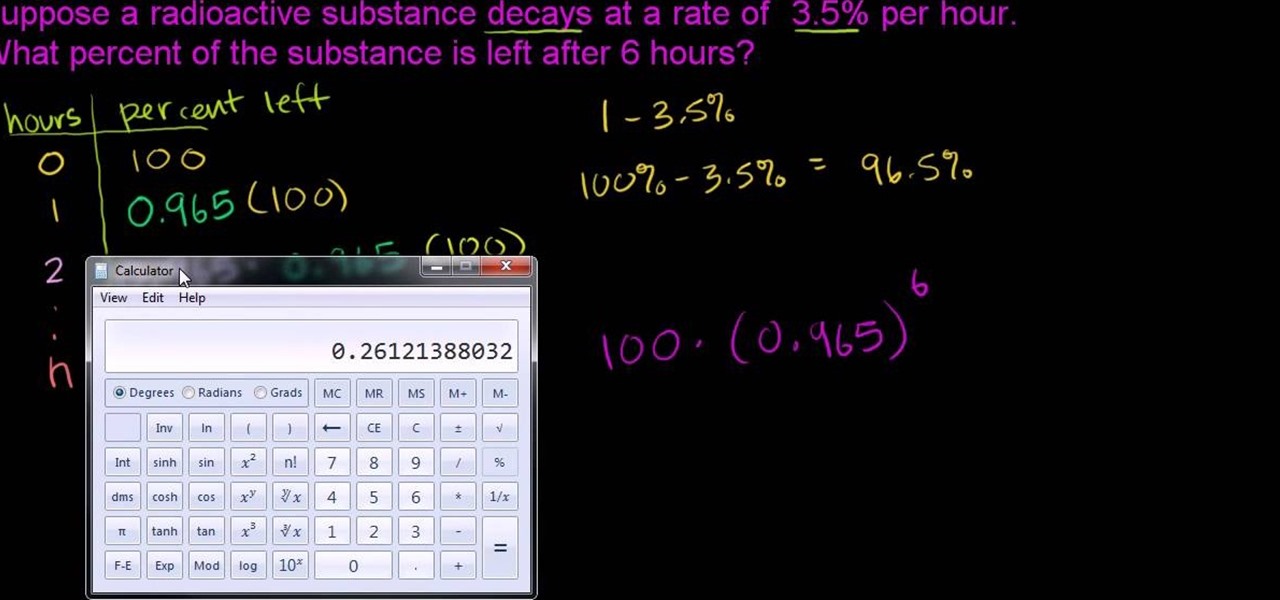
The first problem that is show is exponential decay. First you will need to create a table with hours and substance left. The next step is to find the trend by noting that we are left with a certain percentage of the substance. One you have the trend you will use this to calculate the amount of substance left in said hours, in this case 6 hours. The following example shows you how to solve exponential growth. It is essentially the same except for the fact that you will be increasing, so inste...

We don't know how the ombre hair trend got started, but if nothing else it certainly is interesting. Like ombre clothes, ombre hair fades from one color to another, like watercolor painting. On hair this means a deep brown on the crown of the head fading into a light blond on the tips, for instance.
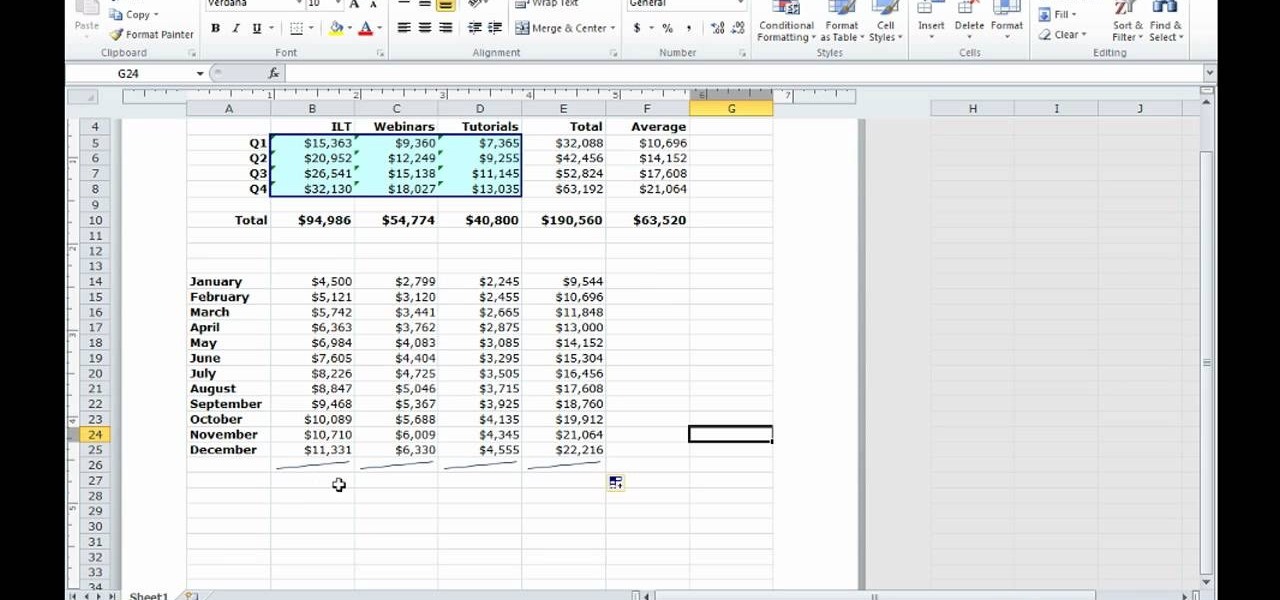
There is a new function in MS Excel 2010 called ‘Sparkline’ which helps you quickly find trends associated with a set of data. To create Sparkline, you can go to ‘Insert’ tab and then select ‘Sparkline’ section and then select the graph type. After you enter the data range and location range, the Sparkline will show up indicating the trend based on the data range you identified earlier. You can change the types and styles of your Sparkline easily. As the video demonstrates, whenever you use E...

There are three big fashion and beauty trends this fall: Cats, camoflage, and bold plums. Take that second trend out for a spin by checking out this makeup tutorial for creating a military camoflage inspired look.

Steampunk, a vintage Victorian mechanical style, is one of the hottest design trends to date since faux bois. Get in on the trend while creating many hours of fun for yourself and friends by making this awesome steampunk style chess set. This chess set is comprised of various pieces of hardware, a found table, and common household chemicals.

Diane Kruger is a veritable It girl always on top of the latest fashion, hair, and makeup trends. In fact, it's safe to say that the German-born actress is ahead of the curve, making all the trends rather than following them.

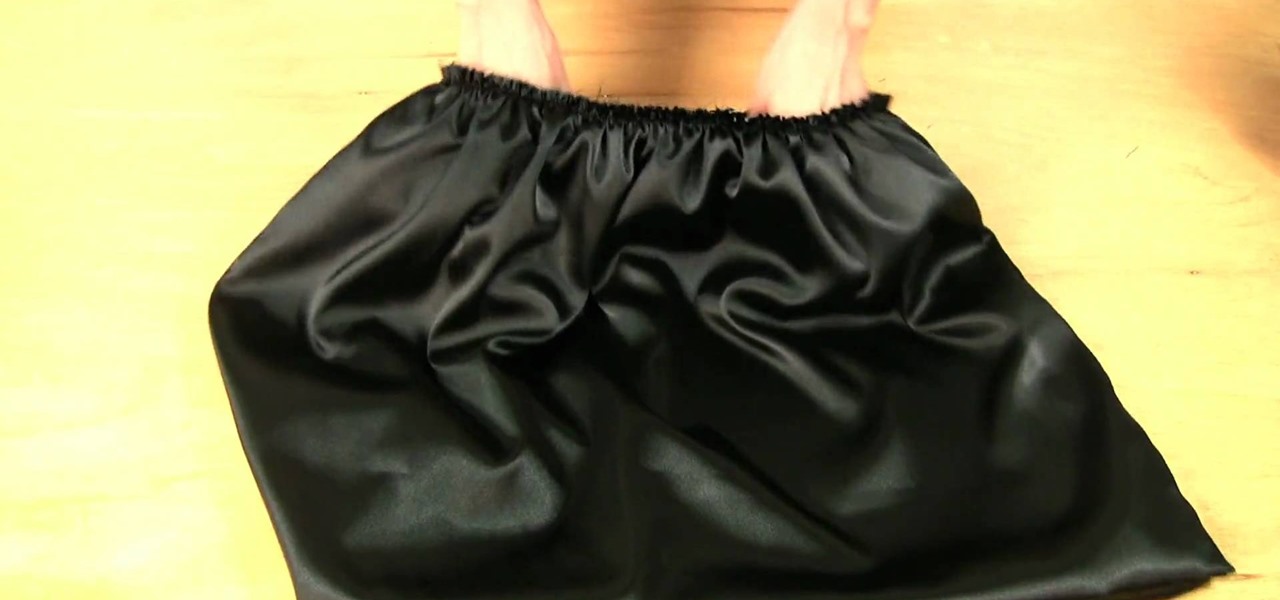
High waisted skirts may seem rather unflattering - after all, the last high-waisted trend we've heard about was high-waisted pants, and after Jessica Simpson's mom jeans controversy that trend has swiftly burned out and died. But because high-waisted skirts fall at your waist, they help create an hourglass silhouette that's flattering on everyone.

In this clip, you'll learn how to make use of Twitter's trending topics feature. What do President Obama, the Dalai Lama and Justin Bieber have in common? Why, they're all on Twitter, of course. Join the party. Whether you're new to Twitter's popular microblogging application or just missed a few of the essentials along the way, you're sure to benefit from this free video tutorial.

Loose curls are the new big thing in hair. Suddenly, all of the starlets are walking around with long, beautifully bouncy curls. How do you think they go from short straight do's to long flowing waves in a matter of months? Hair extensions of course! In this tutorial, learn how to apply long curly extensions yourself and stay up with the latest trends without changing your natural hairstyle. You never know when the trends will switch to short and straight again.. who knows what's next, but wi...

The ombre fashion trend began a few seasons ago on all the biggest fashion runways, from Alexander Wang to Michael Kors. And the fun, colorful trend is still going strong. Ombre simply describes the fading of one color to another, from high saturation to (usually) white or another lighter color.

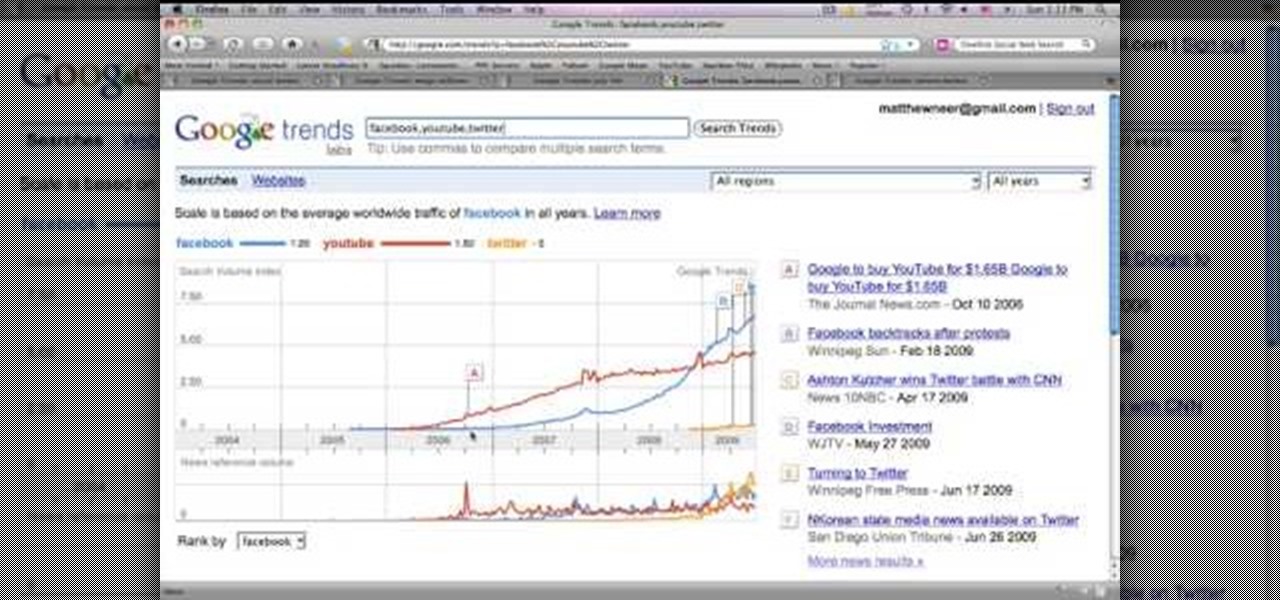
In this Computers & Programming video tutorial you will learn how to track Google's trends features. This will help you find some powerful micro niches and great keywords to create content and get top rankings in search engines. Any trend on the internet first starts with an event. For example ‘mega millions’ gets lot of traffic when someone wins a jackpot or a big lottery draw is coming up. Similarly, ‘July 4th’ traffic spikes around that event and dies down. If you want traffic from this ev...

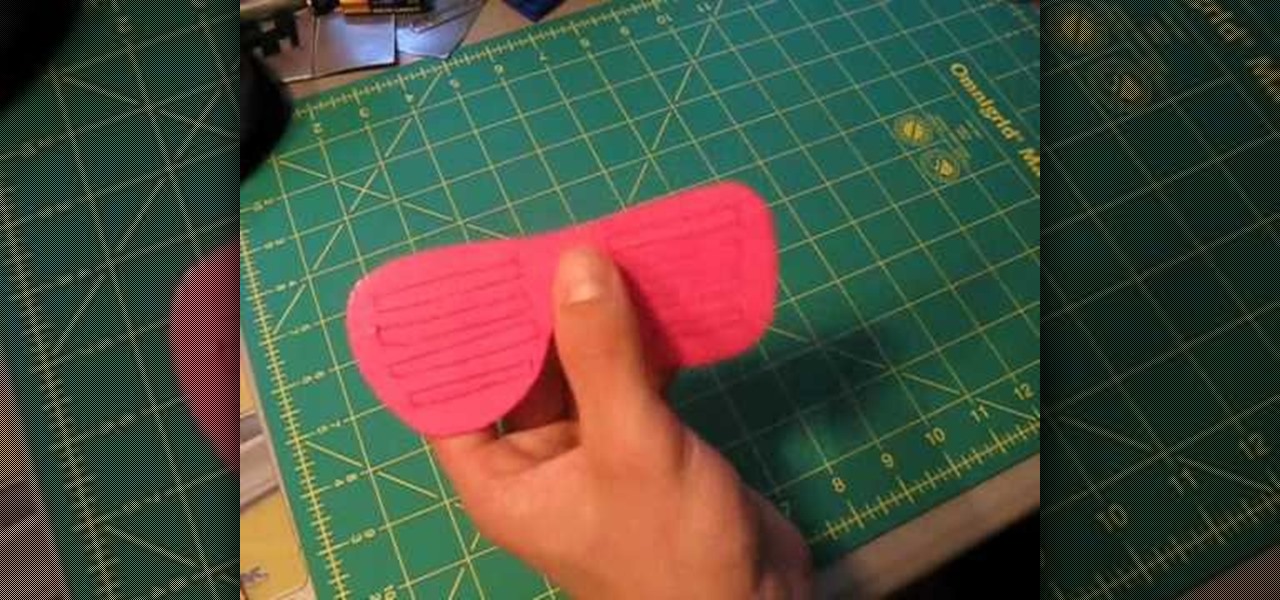
Okay, so the shutter shade trend sort of rode the wave of Kanye West's popularity after he wore it for his video for "Stronger," and then decreased in fan enthusiasm after the Taylor Swift music video incident (your ego is more than your "imaginary friend," Kanye).

The runways are not the likeliest of places to look for makeup trends that are immediately wearable (think the recent fashion show in Spain where models went bald and wore thinning gray beards), but this fall the overall makeup trend has been one that's surprisingly translatable off the runway.

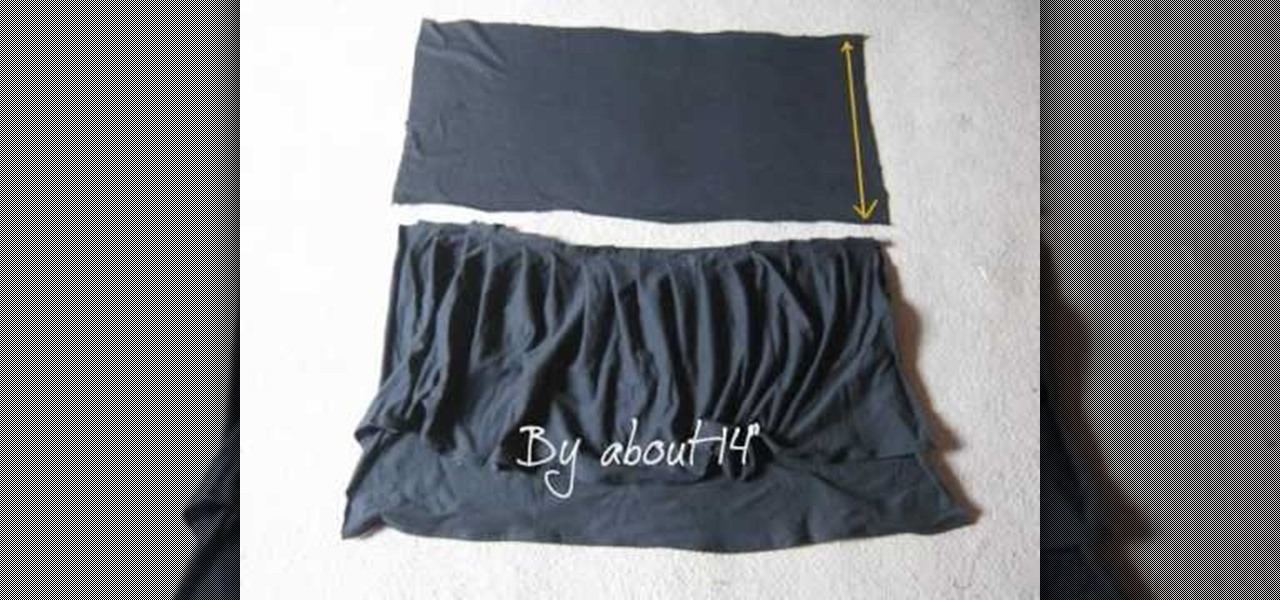
High waists and poofy balloon skirts are both two of the hottest fashion trends this season, seen on stars like Lauren Conrad and Jessica Simpson (yes, of the famous "Mom jean" snafu).

Since the famously bootylicious Beyonce wore blingy, opalescent tinsel in her hair for the 2010 Grammy Awards, tinsel hair has become a cheeky sweet trend in Hollywood fashion.

Ombre and zebra prints are two of the hottest fashion trends this season, but you'd never see the two trends mishmashed together on on person. Until now.

A recent trend in freshwater fishing is adding a fluorocarbon leader to your braided fishing line. The benefits of this are mainly allowing for some more absorbtion of pull, resulting in less twist and potential tangling. This how-to will show you how to tie this knot yourself, so when you're in the middle of that beautiful pond, and you feel the bite, you'll be able to successfully land that big one with less stress on you or your gear.

In an age of trend-following stars and fast fashion turnaround, there are few celebrities left whose looks hearken back to the golden age of Hollywood.

Bangs are the hottest hair trend for spring and summer, but who wants to drop $100 for trim at a salon?

Learn all about the recent Hollywood pregnancy trend of belly casting. The Pregnancy Show gives you an exclusive look at how to make your own belly cast.

While both Rdio and Beats Music look to be developing support for Chromecast, Spotify has kept their distance from the Google dongle, focusing instead on "several prevailing priorities."

Inspired by French sex siren Brigitte Bardot, Jennifer Aniston plays up the sex bombshell angle in the new February issue of "Allure." Wearing little more than a PJ set completely unbuttoned up front, she exudes an effortless glamour.

Japanese Gyaru girls dress up like little girls or dollies. It's a popular look that's definitely easier to wear than some of Japan's other fashion trends, like Goth Lolita or Ganguro.

Leopard print is one of the newest trends, and you can easily create your own leopard print style garment at home. All you need is a basic white T-shirt (or whatever you want to dye), the dye itself and a few other accessories.

This hairstyle is taken directly from the current trends for runway models. Backcomb your hair first to give it a little body, then follow the steps to clamp your hair and hold it in place to achieve the disheveled ballerina look.

Back in the '40s through the '60s, it took very little effort for gorgeous starlet Audrey Hepburn to start new trends. Whether she was sporting a short pixie cute (as in "Roman Holiday") or wearing buggy sunglasses (vide "Breakfast at Tiffany's"), Hepburn was always on the cutting edge.

Fringes are definitely trendy this season, and you can jump on the trend bus without breaking the bank! You can turn an old T-shirt into a fashionable fringed scarf just by making a few cuts. Pick a shirt as colorful as you want!

Visual kei, as with all popular Japanese fashion and makeup movements, started in the Harajuku district of Japan. This particular trend is mostly practiced among musicians who favor a very ostentatious and sometimes androgynous look with heavy, monstrous makeup.

Golden girl Jennifer Aniston never skips a fashion beat on the red carpet (maybe because she 9 times out of 10 wears black, which we know is never not flattering?), but when she stepped foot onto the red carpet last year at an event, she once again started a "Rachel" hair trend.

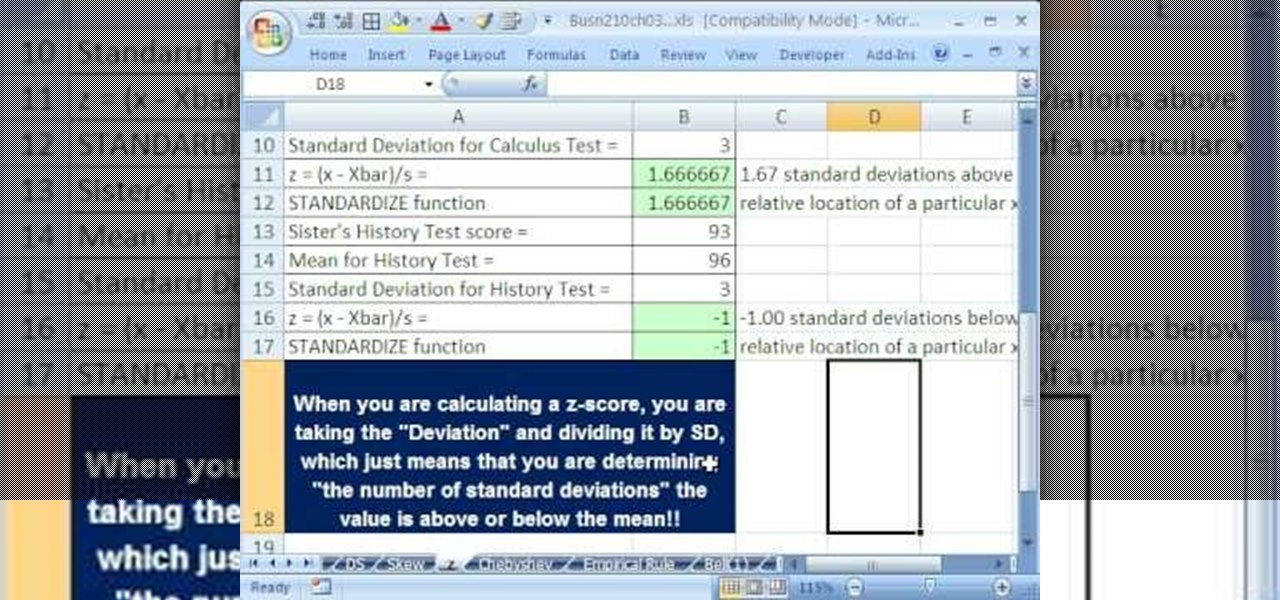
If you use Microsoft Excel on a regular basis, odds are you work with numbers. Put those numbers to work. Statistical analysis allows you to find patterns, trends and probabilities within your data. In this MS Excel tutorial from everyone's favorite Excel guru, YouTube's ExcelsFun, the 45th installment in his "Excel Statistics" series of free video lessons, you'll learn how to see how to calculate a z-score.

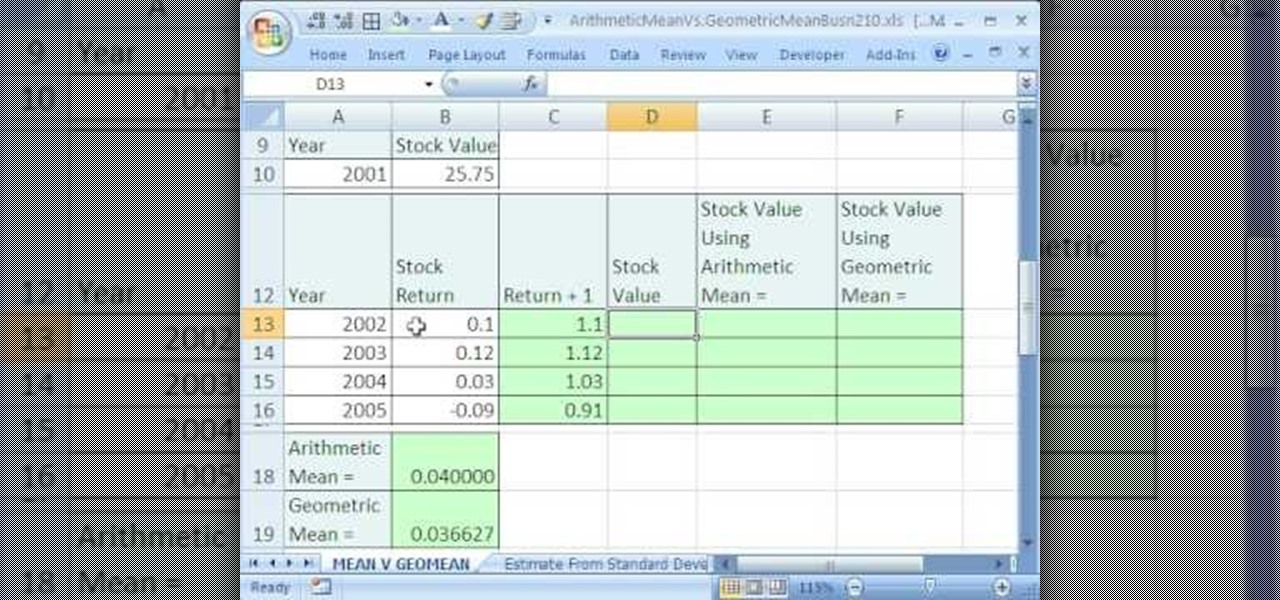
If you use Microsoft Excel on a regular basis, odds are you work with numbers. Put those numbers to work. Statistical analysis allows you to find patterns, trends and probabilities within your data. In this MS Excel tutorial from everyone's favorite Excel guru, YouTube's ExcelsFun, the 35.2nd installment in his "Excel Statistics" series of free video lessons, you'll learn how to use Excel's GEOMEAN function to find geometric mean.

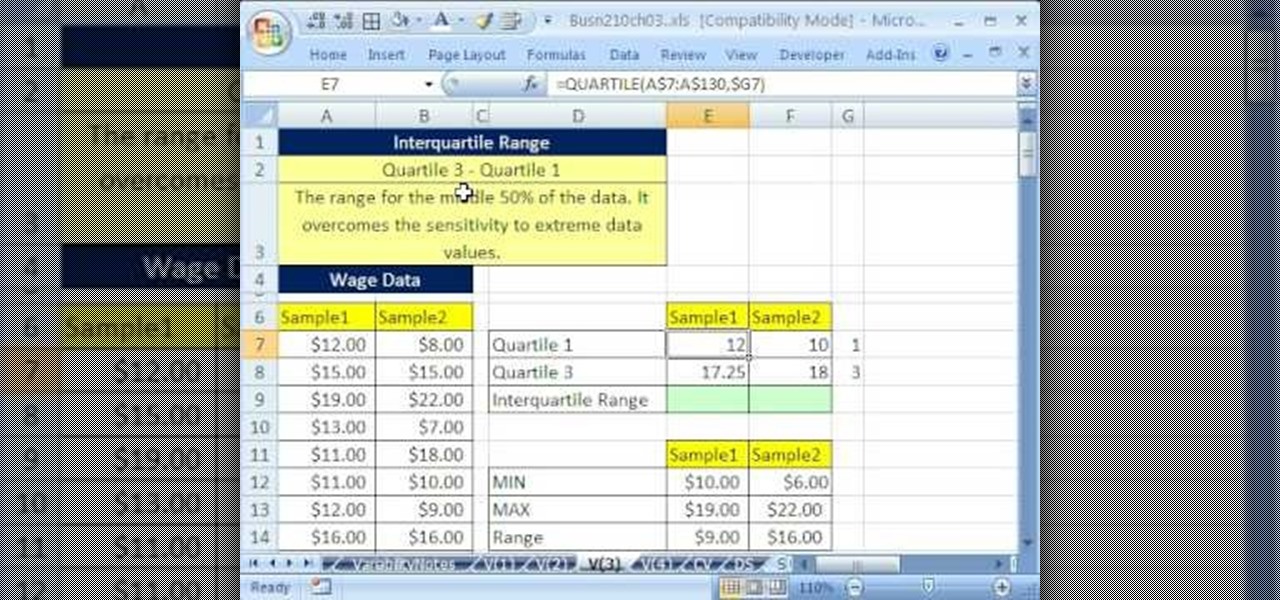
If you use Microsoft Excel on a regular basis, odds are you work with numbers. Put those numbers to work. Statistical analysis allows you to find patterns, trends and probabilities within your data. In this MS Excel tutorial from everyone's favorite Excel guru, YouTube's ExcelsFun, the 40th installment in his "Excel Statistics" series of free video lessons, you'll learn how to calculate range & interquartile range for variability using the MAX, MIN, QUARTILE functions.

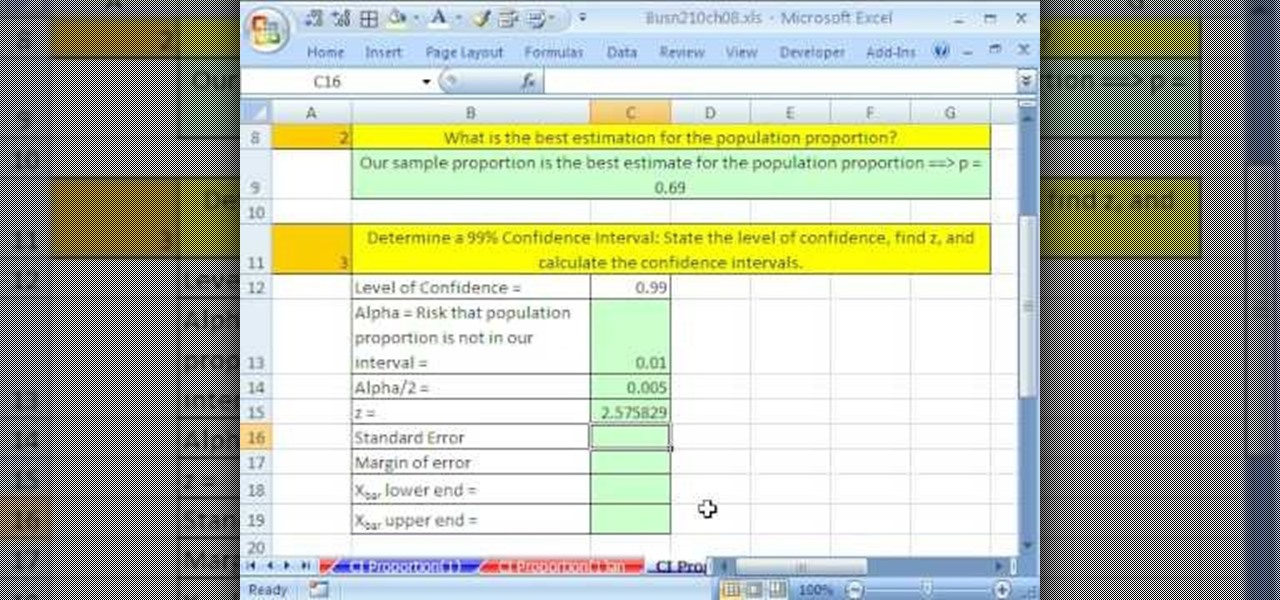
If you use Microsoft Excel on a regular basis, odds are you work with numbers. Put those numbers to work. Statistical analysis allows you to find patterns, trends and probabilities within your data. In this MS Excel tutorial from everyone's favorite Excel guru, YouTube's ExcelsFun, the 86th installment in his "Excel Statistics" series of free video lessons, you'll learn how to construct confidence intervals for proportions using NORMSINV function and other formulas.

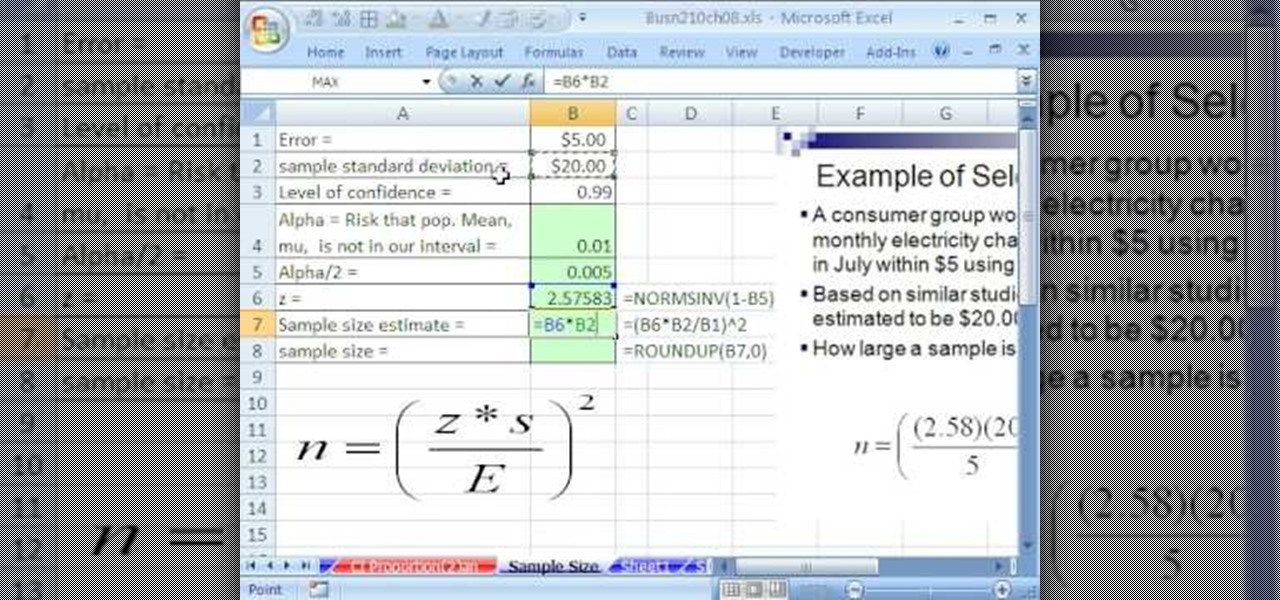
If you use Microsoft Excel on a regular basis, odds are you work with numbers. Put those numbers to work. Statistical analysis allows you to find patterns, trends and probabilities within your data. In this MS Excel tutorial from everyone's favorite Excel guru, YouTube's ExcelsFun, the 87th installment in his "Excel Statistics" series of free video lessons, you'll learn how to calculate sample size (n) for confidence intervals.

If you use Microsoft Excel on a regular basis, odds are you work with numbers. Put those numbers to work. Statistical analysis allows you to find patterns, trends and probabilities within your data. In this MS Excel tutorial from everyone's favorite Excel guru, YouTube's ExcelsFun, the 27th installment in his "Excel Statistics" series of free video lessons, you'll learn how to create a quantitative data dot plot chart using the REPT and COUNTIF functions.

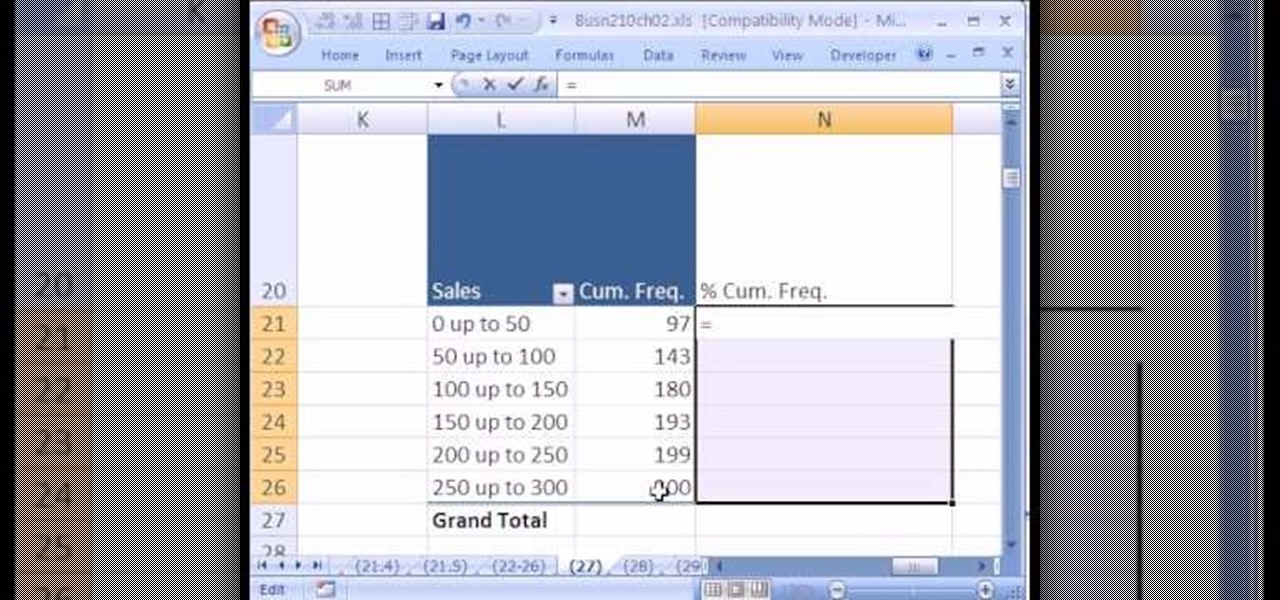
If you use Microsoft Excel on a regular basis, odds are you work with numbers. Put those numbers to work. Statistical analysis allows you to find patterns, trends and probabilities within your data. In this MS Excel tutorial from everyone's favorite Excel guru, YouTube's ExcelsFun, the 26th installment in his "Excel Statistics" series of free video lessons, you'll learn how to create quantitative data cumulative frequency distributions with pivot tables.

If you use Microsoft Excel on a regular basis, odds are you work with numbers. Put those numbers to work. Statistical analysis allows you to find patterns, trends and probabilities within your data. In this MS Excel tutorial from everyone's favorite Excel guru, YouTube's ExcelsFun, the 16th installment in his "Excel Statistics" series of free video lessons, you'll learn how to cross tabulate & do percentage cross tabulation for categorical data using a pivot table (PivotTable).

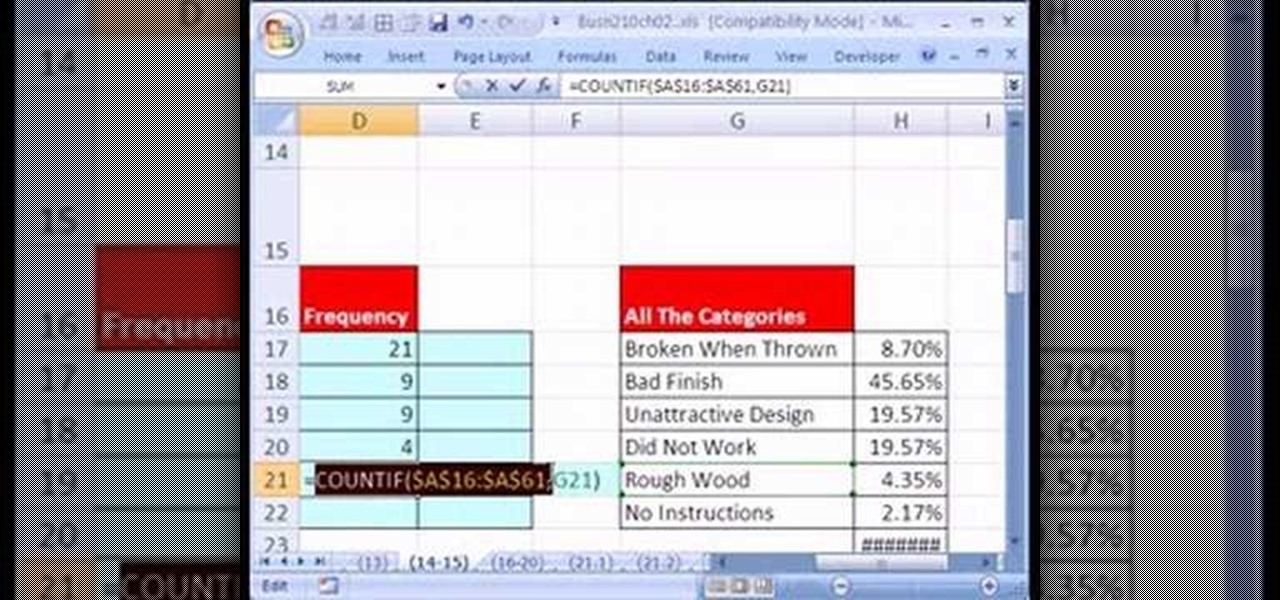
If you use Microsoft Excel on a regular basis, odds are you work with numbers. Put those numbers to work. Statistical analysis allows you to find patterns, trends and probabilities within your data. In this MS Excel tutorial from everyone's favorite Excel guru, YouTube's ExcelsFun, the 19th installment in his "Excel Statistics" series of free video lessons, you'll learn how to group categories in a frequency distribution with a formula (2 COUNTIF) and the pivot table (PivotTable) grouping fea...

If you use Microsoft Excel on a regular basis, odds are you work with numbers. Put those numbers to work. Statistical analysis allows you to find patterns, trends and probabilities within your data. In this MS Excel tutorial from everyone's favorite Excel guru, YouTube's ExcelsFun, the 17th installment in his "Excel Statistics" series of free video lessons, you'll learn how to cross tabulate & do percentage cross tabulation for categorical data using formulas rather than pivot tables.


