In a series of news about the OnePlus 5, the company posted its first teaser of the upcoming device on its Weibo account. According to GSM Arena, the teaser doesn't show us any sneak peaks of what the phone might look like — co-founder Carl Pei took care of that — though, we are greeted with the caption "Hey Summer! Give me five!"

NBA star Andre Iguodala, of the Golden State Warriors, got to try out a Magic Leap demo in Florida and started dishing out some pretty revealing details about the upcoming mixed reality headset to CNET's Brian Tong.

Google's new Inbox by Gmail service wants to fundamentally change the way you handle email, so a bit of a learning curve is to be expected when you're first using the utility. As of right now, the service is invite-only, but if you were lucky enough to get in on the ground floor, you're probably wondering, "How the heck do I use this thing?"

Buried deep in the code of many Google apps is a set of debugging options. These options, which are designed for developers to help test the way their apps interact with Google's own, are normally hidden from view.

Inspired by French sex siren Brigitte Bardot, Jennifer Aniston plays up the sex bombshell angle in the new February issue of "Allure." Wearing little more than a PJ set completely unbuttoned up front, she exudes an effortless glamour.

Japanese Gyaru girls dress up like little girls or dollies. It's a popular look that's definitely easier to wear than some of Japan's other fashion trends, like Goth Lolita or Ganguro.

Leopard print is one of the newest trends, and you can easily create your own leopard print style garment at home. All you need is a basic white T-shirt (or whatever you want to dye), the dye itself and a few other accessories.

This hairstyle is taken directly from the current trends for runway models. Backcomb your hair first to give it a little body, then follow the steps to clamp your hair and hold it in place to achieve the disheveled ballerina look.

Back in the '40s through the '60s, it took very little effort for gorgeous starlet Audrey Hepburn to start new trends. Whether she was sporting a short pixie cute (as in "Roman Holiday") or wearing buggy sunglasses (vide "Breakfast at Tiffany's"), Hepburn was always on the cutting edge.

Embed Facebook directly into your Internet Explorer or Mozilla Firefox browser's toolbar using this nifty new add-on directly from the people at Facebook themselves. This addon shows you on the toolbar the number of pokes, friend requests, unread messages and upcoming events that you have, in addition to quick links to various sections of the Facebook site. In this demo video, Patrick from Tekzilla explains the cool new features and details.

Fringes are definitely trendy this season, and you can jump on the trend bus without breaking the bank! You can turn an old T-shirt into a fashionable fringed scarf just by making a few cuts. Pick a shirt as colorful as you want!

Visual kei, as with all popular Japanese fashion and makeup movements, started in the Harajuku district of Japan. This particular trend is mostly practiced among musicians who favor a very ostentatious and sometimes androgynous look with heavy, monstrous makeup.

Golden girl Jennifer Aniston never skips a fashion beat on the red carpet (maybe because she 9 times out of 10 wears black, which we know is never not flattering?), but when she stepped foot onto the red carpet last year at an event, she once again started a "Rachel" hair trend.

In this video, learn how to decorate a cake that looks like a perfect soccer field. This is a great way to celebrate the upcoming World Cup game and includes everything from grass to players to goal posts. This adorable little cake will make an impressive - and delicious - addition to any event!

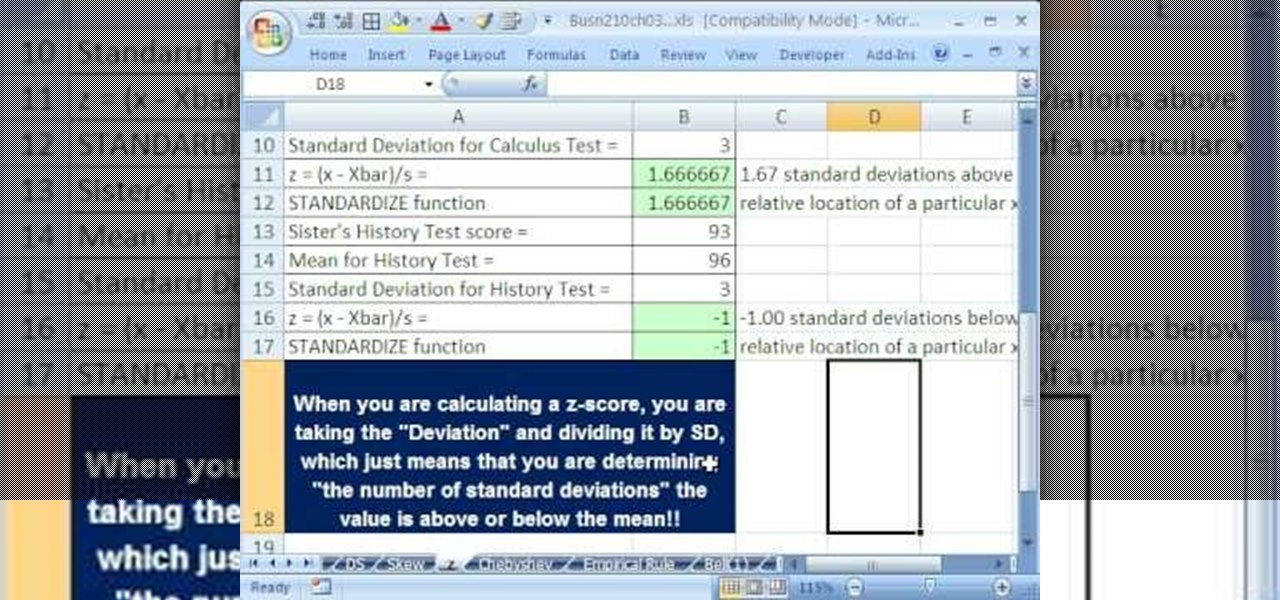
If you use Microsoft Excel on a regular basis, odds are you work with numbers. Put those numbers to work. Statistical analysis allows you to find patterns, trends and probabilities within your data. In this MS Excel tutorial from everyone's favorite Excel guru, YouTube's ExcelsFun, the 45th installment in his "Excel Statistics" series of free video lessons, you'll learn how to see how to calculate a z-score.

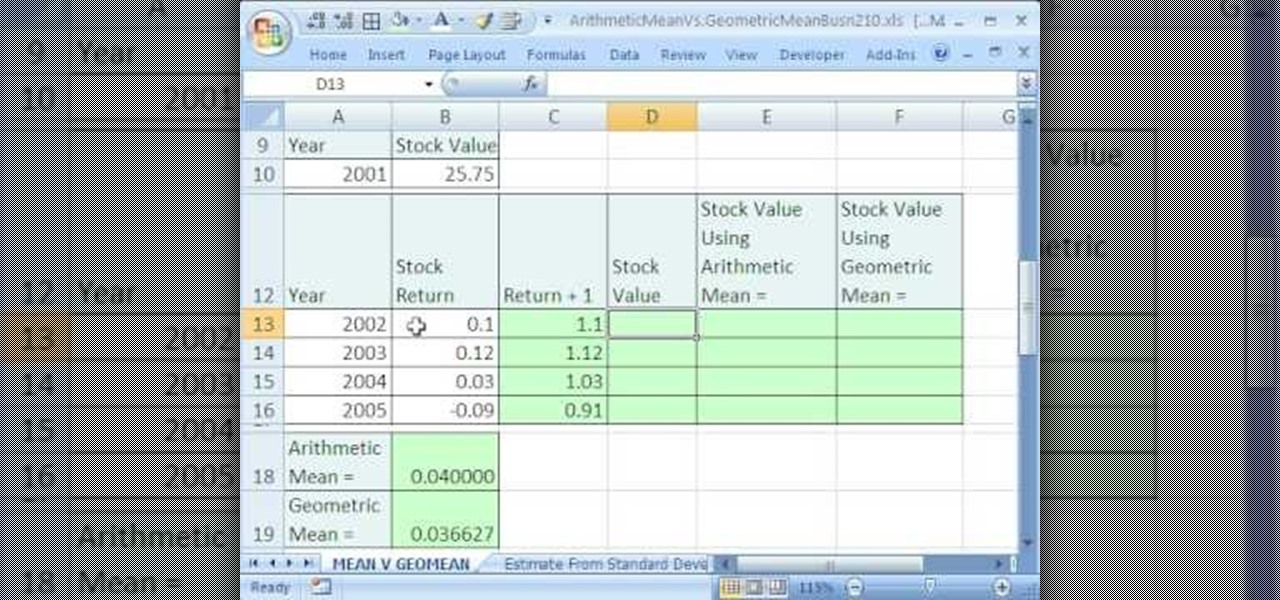
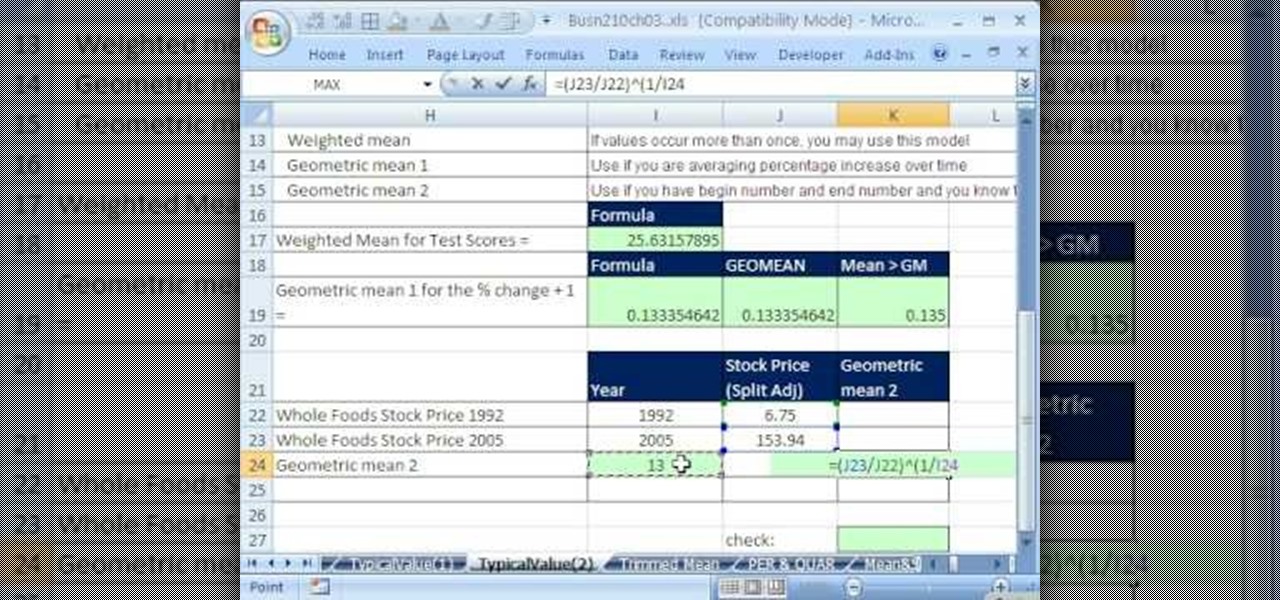
If you use Microsoft Excel on a regular basis, odds are you work with numbers. Put those numbers to work. Statistical analysis allows you to find patterns, trends and probabilities within your data. In this MS Excel tutorial from everyone's favorite Excel guru, YouTube's ExcelsFun, the 35.2nd installment in his "Excel Statistics" series of free video lessons, you'll learn how to use Excel's GEOMEAN function to find geometric mean.

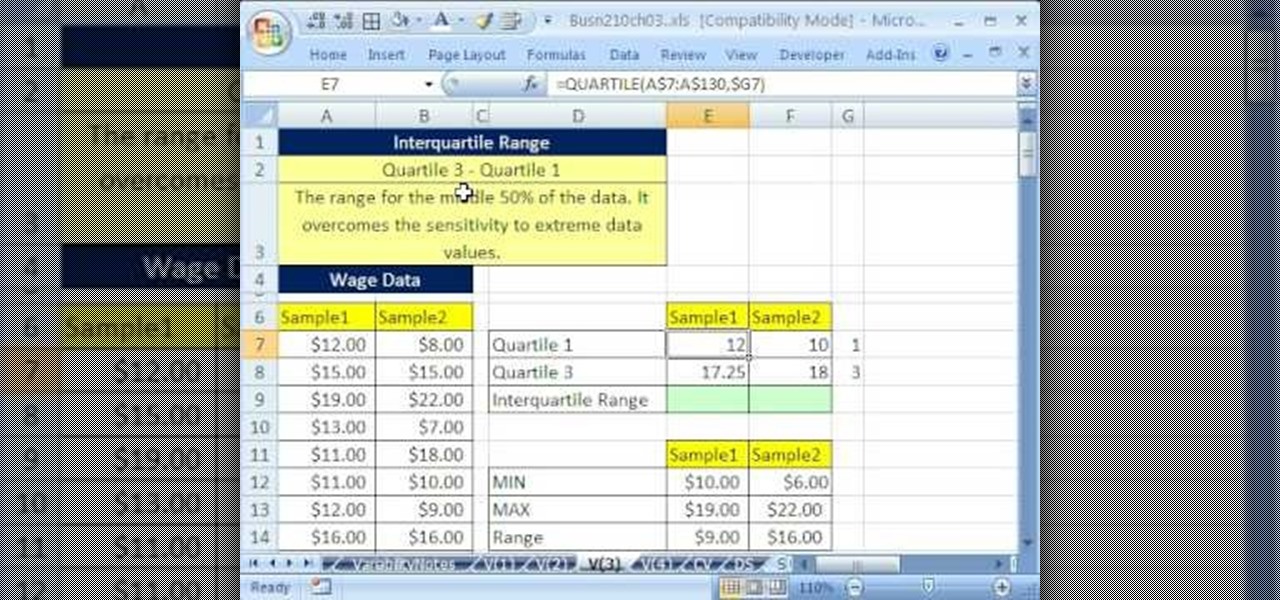
If you use Microsoft Excel on a regular basis, odds are you work with numbers. Put those numbers to work. Statistical analysis allows you to find patterns, trends and probabilities within your data. In this MS Excel tutorial from everyone's favorite Excel guru, YouTube's ExcelsFun, the 40th installment in his "Excel Statistics" series of free video lessons, you'll learn how to calculate range & interquartile range for variability using the MAX, MIN, QUARTILE functions.

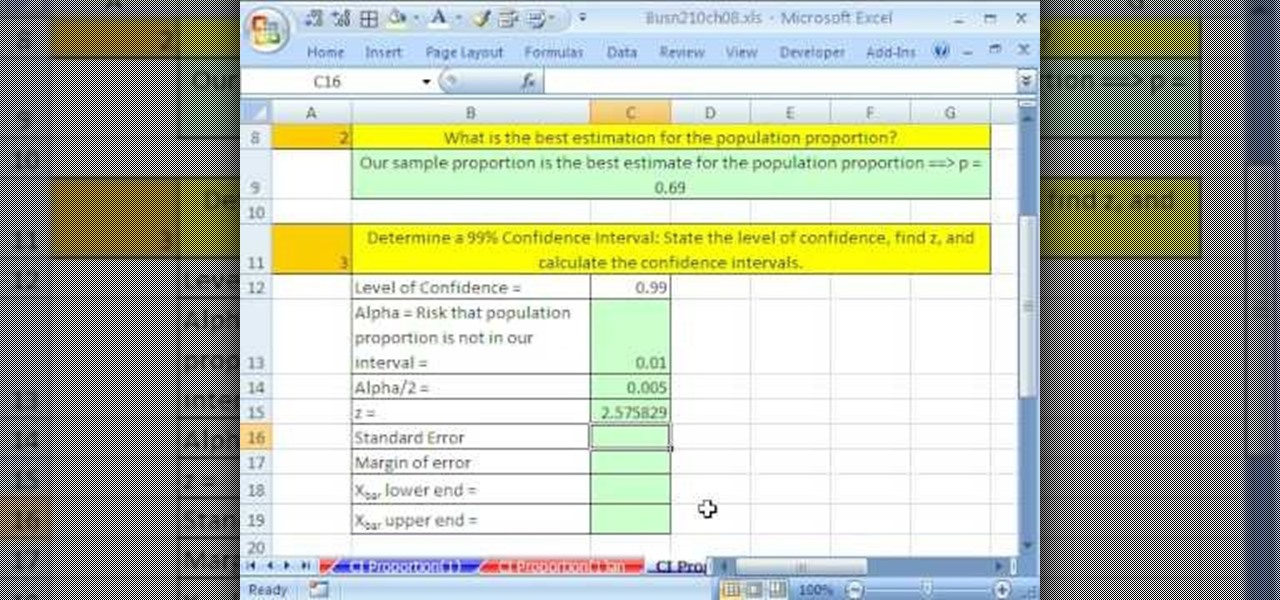
If you use Microsoft Excel on a regular basis, odds are you work with numbers. Put those numbers to work. Statistical analysis allows you to find patterns, trends and probabilities within your data. In this MS Excel tutorial from everyone's favorite Excel guru, YouTube's ExcelsFun, the 86th installment in his "Excel Statistics" series of free video lessons, you'll learn how to construct confidence intervals for proportions using NORMSINV function and other formulas.

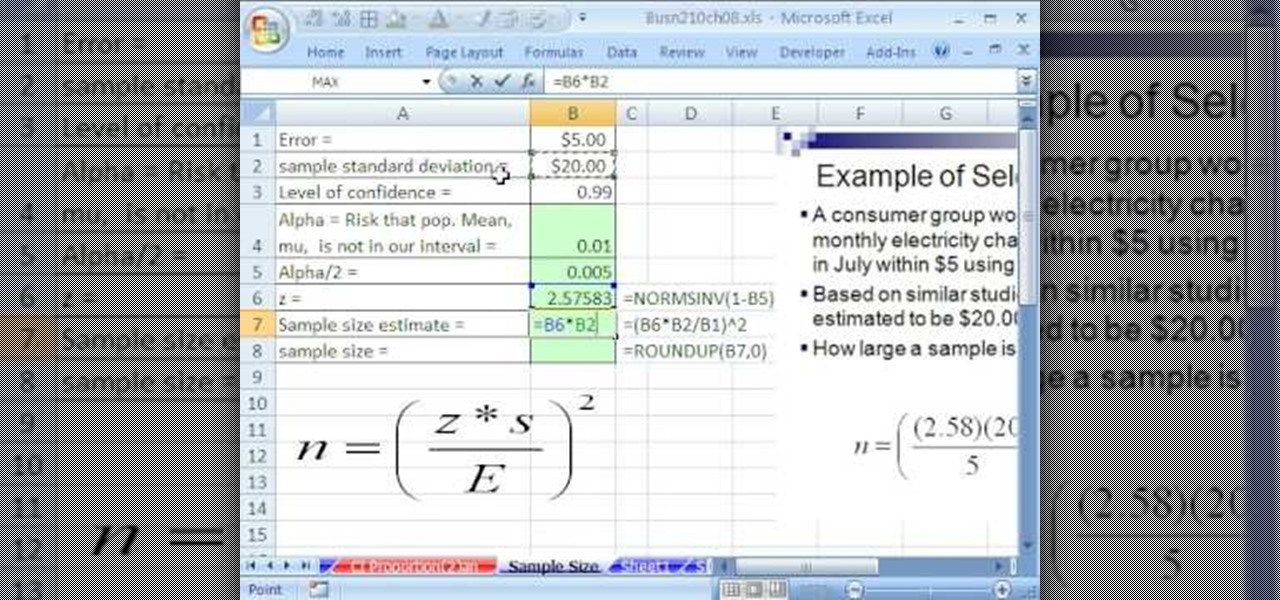
If you use Microsoft Excel on a regular basis, odds are you work with numbers. Put those numbers to work. Statistical analysis allows you to find patterns, trends and probabilities within your data. In this MS Excel tutorial from everyone's favorite Excel guru, YouTube's ExcelsFun, the 87th installment in his "Excel Statistics" series of free video lessons, you'll learn how to calculate sample size (n) for confidence intervals.

If you use Microsoft Excel on a regular basis, odds are you work with numbers. Put those numbers to work. Statistical analysis allows you to find patterns, trends and probabilities within your data. In this MS Excel tutorial from everyone's favorite Excel guru, YouTube's ExcelsFun, the 27th installment in his "Excel Statistics" series of free video lessons, you'll learn how to create a quantitative data dot plot chart using the REPT and COUNTIF functions.

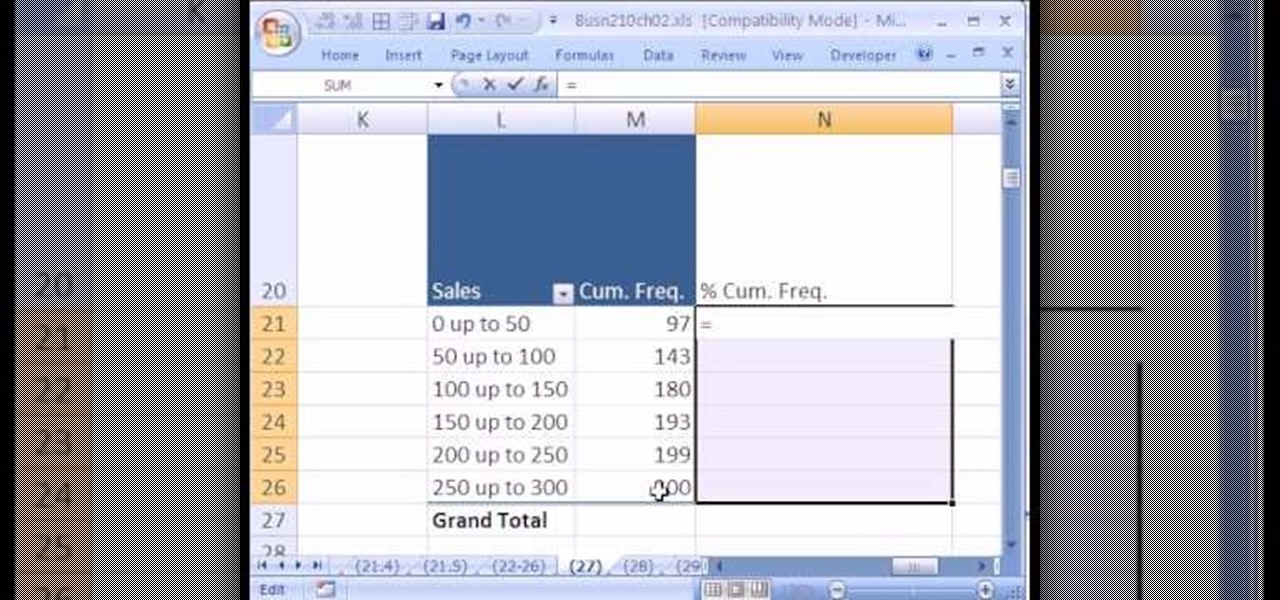
If you use Microsoft Excel on a regular basis, odds are you work with numbers. Put those numbers to work. Statistical analysis allows you to find patterns, trends and probabilities within your data. In this MS Excel tutorial from everyone's favorite Excel guru, YouTube's ExcelsFun, the 26th installment in his "Excel Statistics" series of free video lessons, you'll learn how to create quantitative data cumulative frequency distributions with pivot tables.

If you use Microsoft Excel on a regular basis, odds are you work with numbers. Put those numbers to work. Statistical analysis allows you to find patterns, trends and probabilities within your data. In this MS Excel tutorial from everyone's favorite Excel guru, YouTube's ExcelsFun, the 16th installment in his "Excel Statistics" series of free video lessons, you'll learn how to cross tabulate & do percentage cross tabulation for categorical data using a pivot table (PivotTable).

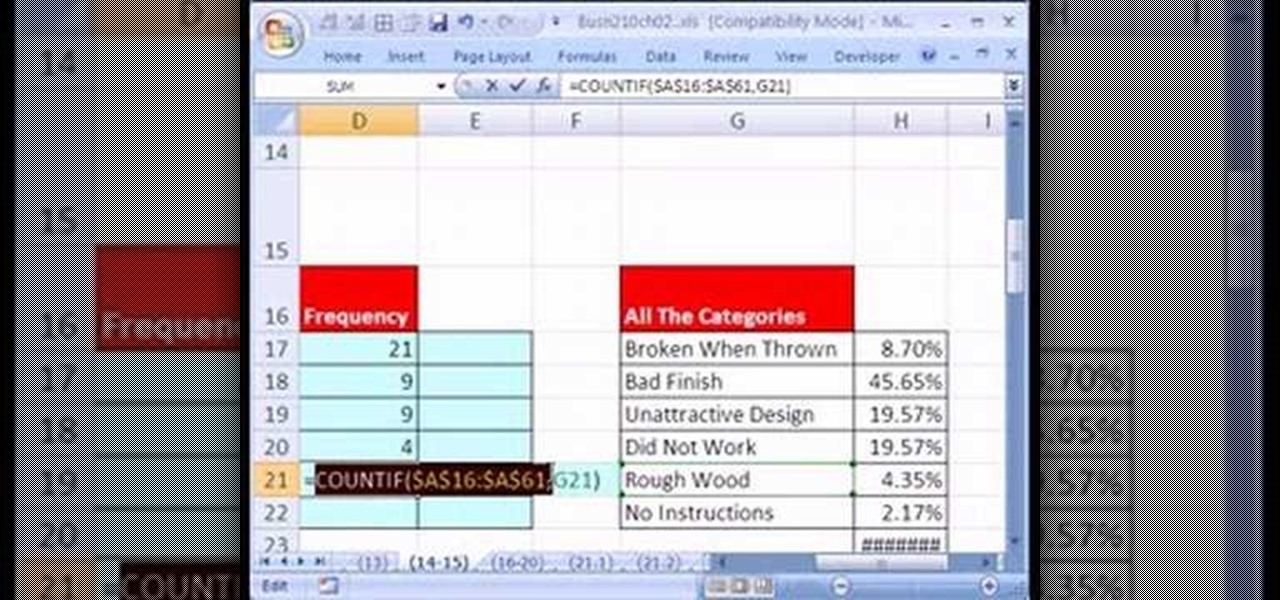
If you use Microsoft Excel on a regular basis, odds are you work with numbers. Put those numbers to work. Statistical analysis allows you to find patterns, trends and probabilities within your data. In this MS Excel tutorial from everyone's favorite Excel guru, YouTube's ExcelsFun, the 19th installment in his "Excel Statistics" series of free video lessons, you'll learn how to group categories in a frequency distribution with a formula (2 COUNTIF) and the pivot table (PivotTable) grouping fea...

If you use Microsoft Excel on a regular basis, odds are you work with numbers. Put those numbers to work. Statistical analysis allows you to find patterns, trends and probabilities within your data. In this MS Excel tutorial from everyone's favorite Excel guru, YouTube's ExcelsFun, the 17th installment in his "Excel Statistics" series of free video lessons, you'll learn how to cross tabulate & do percentage cross tabulation for categorical data using formulas rather than pivot tables.

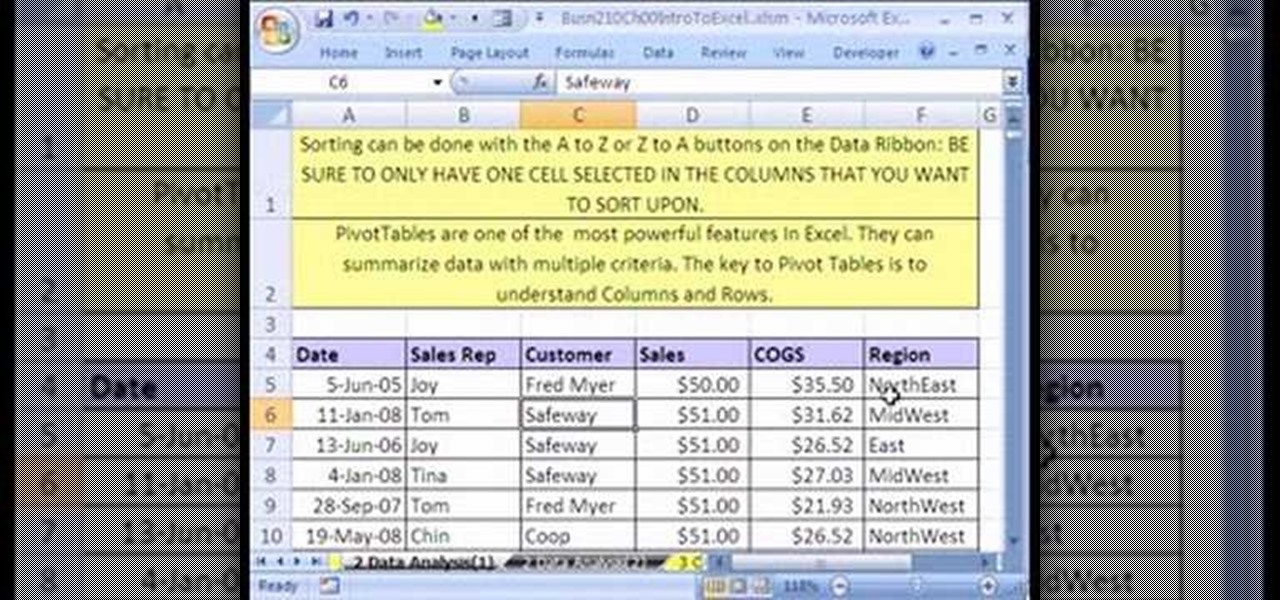
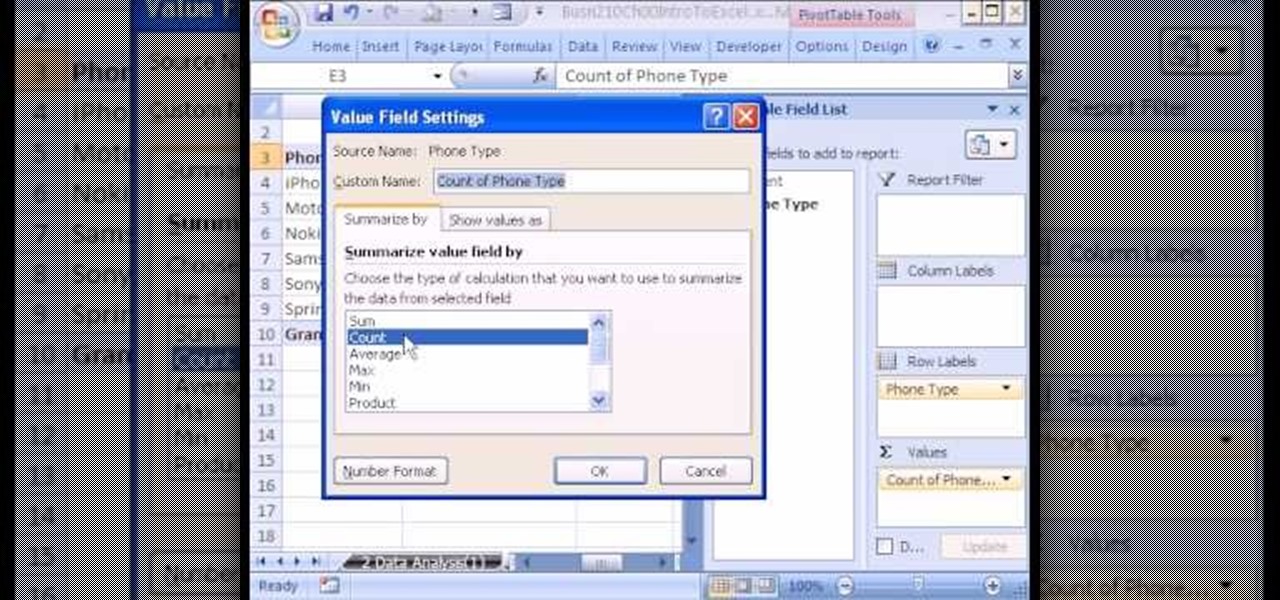
If you use Microsoft Excel on a regular basis, odds are you work with numbers. Put those numbers to work. Statistical analysis allows you to find patterns, trends and probabilities within your data. In this MS Excel tutorial from everyone's favorite Excel guru, YouTube's ExcelsFun, the 3rd installment in his "Excel Statistics" series of free video lessons, you'll learn how to use Excel's sorting and pivot tables (PivotTables) data analysis tools.

If you use Microsoft Excel on a regular basis, odds are you work with numbers. Put those numbers to work. Statistical analysis allows you to find patterns, trends and probabilities within your data. In this MS Excel tutorial from everyone's favorite Excel guru, YouTube's ExcelsFun, the 35th installment in his "Excel Statistics" series of free video lessons, you'll learn how to calculate weighted and geometric means and see how to use the GEOMEAN function.

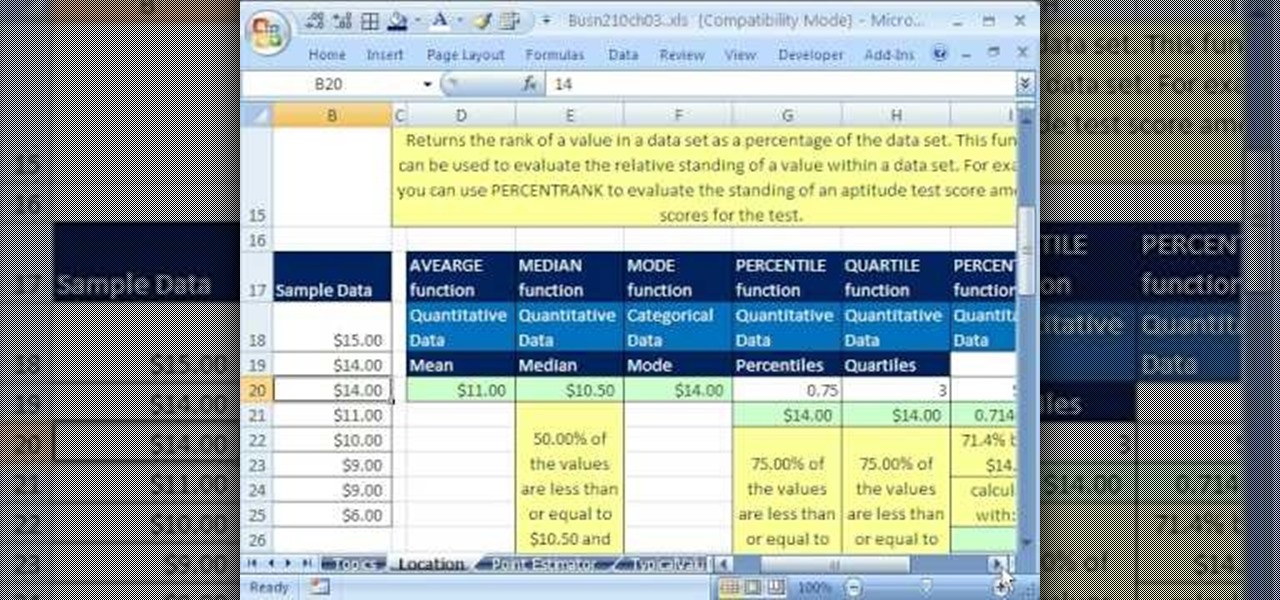
If you use Microsoft Excel on a regular basis, odds are you work with numbers. Put those numbers to work. Statistical analysis allows you to find patterns, trends and probabilities within your data. In this MS Excel tutorial from everyone's favorite Excel guru, YouTube's ExcelsFun, the 33rd installment in his "Excel Statistics" series of free video lessons, you'll learn how to use the AVEARGE, MEDIAN, MODE, PERCENTILE, QUARTILE and PERCENTILERANK functions to measure location.

If you use Microsoft Excel on a regular basis, odds are you work with numbers. Put those numbers to work. Statistical analysis allows you to find patterns, trends and probabilities within your data. In this MS Excel tutorial from everyone's favorite Excel guru, YouTube's ExcelsFun, the 4th installment in his "Excel Statistics" series of free video lessons, you'll learn how to create a frequency table and percentage frequency table using a Pivot Table (PivotTable).

Whether you’re an Oscar nominee or a new mom with an upcoming high school reunion, these tricks will get you into that va-va-voom dress without splitting the seams.

This how-to video is a guide on how to make a Jack-O-Lantern of Barack Obama, the Democratic Presidential Candidate, in spirit of the upcoming election and Halloween. You will need a pumpkin, a picture of Barack Obama, carving tools, and newspaper. This is one jack-o-lantern you'll want to keep up after Halloween. Watch this video tutorial and learn how to carve a Barack Obama pumpkin for Halloween.

With iTunes, you can easily DJ a party by using the party shuffle playlist. This playlist selects a few songs from your library at random and allows you to rearrange upcoming songs.

This is a very easy achievement you can learn when playing World of Keflings - Go Ahead and Jump, worth 15 gamerscore. To do this, you will have to watch a kefling bounce from canon to canon in a complete circuit.

Roller derby is a sport (kind of) that involves two teams skating rounds around an oval track and trying to get ahead of one another. The fun, of course, is that there are "blockers" who try to prevent the "jammers," or scoring players, from getting ahead.

The iPhone is great. And so is Google Maps. And together, they define mobility. They go together perfectly. Like yin and yang. But how do you get the most out of Google Maps on the iPhone? Best Buy has answers. The Best Buy Mobile team explains how simple it is to use Google Maps on your Apple iPhone for directions.

Samsung will be launching the next edition of its Galaxy Note series in less than a month, and we're starting to get some solid information about the upcoming phablet. As previously rumored, Samsung is skipping a number on this year's model, so the new model will be called the Galaxy Note7.

In the upcoming version of Fifa 12, you can actually play as the goal keeper during a match. You can try it out in the demo of the game available now. Check out this guide on how to switch to goalkeeper mode in Fifa 12.

There's always a lot going on in the craft world, with ingenious new products being made every day. But there are also trends in decorating that rise up and end up on every crafter's blog. Right now, that ternd is garlands.

Crackled glass has made its appearance in lots of cultural avenues, including nail polish (remember the crackled nail polish trend popular a few years back?), glass designs, and now, cards.

In this clip, you'll learn how to incorporate hashtags or hash tags into your tweets on Twitter. What do President Obama, the Dalai Lama and Justin Bieber have in common? Why, they're all on Twitter, of course. Join the party. Whether you're new to Twitter's popular microblogging application or just missed a few of the essentials along the way, you're sure to benefit from this free video tutorial.

Interested in using Facebook as a platform to invite your friends to an upcoming event? It's easy! So easy, in fact, that this video tutorial from Butterscotch can present a complete, step-by-step overview of the process in about a minute and a half. For detailed instructions, and to get started creating events on Facebook yourself, take a look.


