Girl next door Jennifer Aniston is a master of sexy yet low maintenance hairstyles. She did famously start "The Rachel" haircut trend, which spread to salons all over America and remains a haircut staple today.

Besides crushed velvet clothing and accessories and anything with a lot of sparkly sequins, tribal jewelry is very in this holiday season. While it isn't necessarily as festive or as glitzy as the other fashion trends, it's uniquely, naturally beautiful and really makes a statement.

Got a bunch of old, too large t-shirts lying around that you don't want to throw away, but that you also can't seem to wear? Then take the high road by upcycling it into this on-trend puff sleeved shirt.

Bohemian hair, fashion, and beauty have been super hot in Hollywood for the past year or so, and the trend is showing no signs of slowing down. While many hip young designers offer bohemian bangles and earrings at trendy L.A. boutiques, avoid denting your wallet with their overpriced goods by making some bohemian earrings yourself!

With winter in full swing, it's time to bring the scarves out of the closet. The trend this year is the tube scarf or infinity scarf, and here is how you can take a scarf you already have and update it to this style.

"Scene" bangs is just a fancy way of saying cool-looking, hipster bangs. You can't rock the hipster trend the way it was meant to be rocked if you only have the skinny jeans, loose organic cotton top, and bangles, right?

Anyone in the world of makeup knows who Pat McGrath is. The world renowned makeup artist recently did the makeup for a catwalk for designer Roberto Caballi, and instead of taking the usual black smokey eyes look, she went for a new trend this season— BROWN! In this tutorial, you'll learn how to create a bold and beautiful brown smokey eyes look, great for the autumn and winter months.
Dolls may freak the rest of us out, but for a lot of girls in Japan looking like a doll - scarily large, beady eyes, perfect ringlets, and porcelain skin - is its own beauty and style trend.
Braids seem to be the latest Hollywood trend. Very rarely do you see boho stars like Nicole Richie, Blake Lively, Mary-Kate Olsen or Mischa Barton without at least one twisted strand in their hair.
Feeling a tad bored with your look? Get some fashion help from Emmy-nominated costume designer, Cate Adair, on how to dress like a young, hot Hollywood celebrity. Looking like a Hollywood celebrity involves taking fashion risks, such as mixing designer clothing with vintage pieces, wearing over-the-top accessories and bringing back old trends. Find ways to dress like a hot young star with tips found in this how-to video.
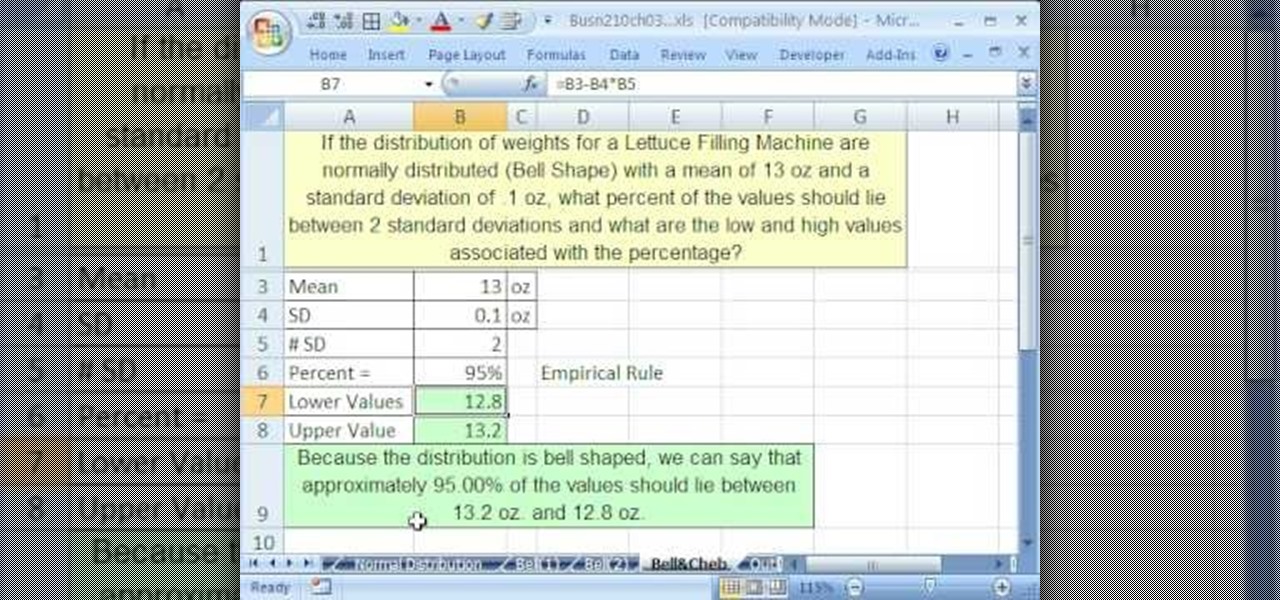
If you use Microsoft Excel on a regular basis, odds are you work with numbers. Put those numbers to work. Statistical analysis allows you to find patterns, trends and probabilities within your data. In this MS Excel tutorial from everyone's favorite Excel guru, YouTube's ExcelsFun, the 48th installment in his "Excel Statistics" series of free video lessons, you'll see comparison of Chebyshev's Theorem and the Empirical Rule (bell curve) and learn when to apply which.
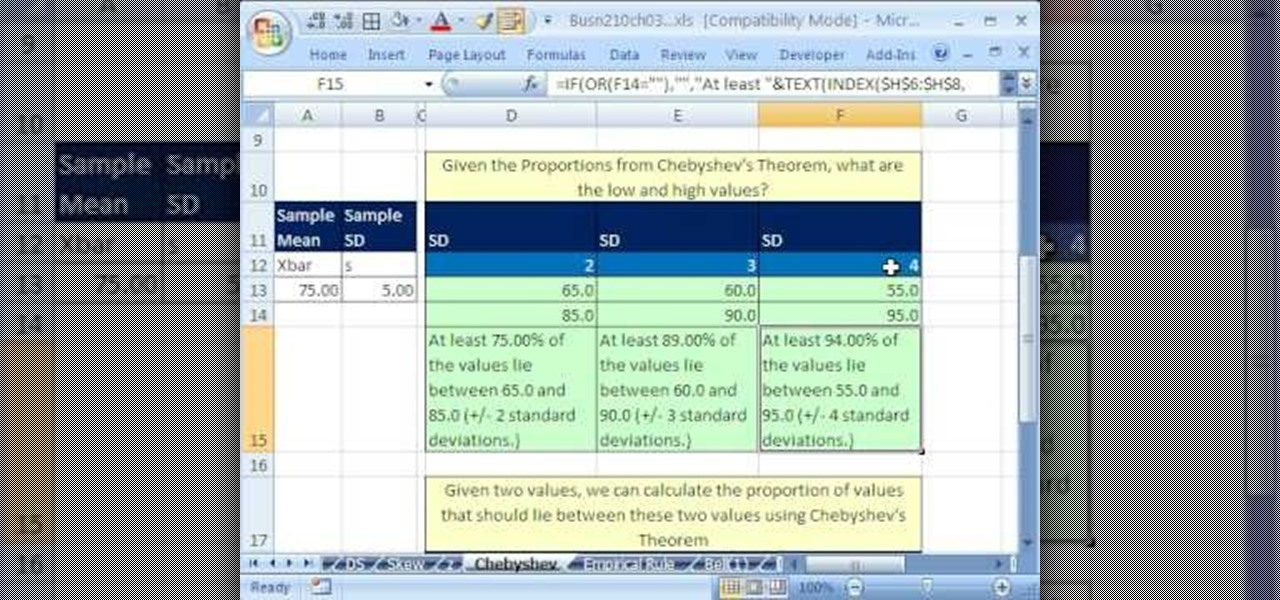
If you use Microsoft Excel on a regular basis, odds are you work with numbers. Put those numbers to work. Statistical analysis allows you to find patterns, trends and probabilities within your data. In this MS Excel tutorial from everyone's favorite Excel guru, YouTube's ExcelsFun, the 46th installment in his "Excel Statistics" series of free video lessons, you'll learn about Chebyshev's Theorem and how to apply it in three different ways.
If you use Microsoft Excel on a regular basis, odds are you work with numbers. Put those numbers to work. Statistical analysis allows you to find patterns, trends and probabilities within your data. In this MS Excel tutorial from everyone's favorite Excel guru, YouTube's ExcelsFun, the 43rd installment in his "Excel Statistics" series of free video lessons, you'll learn how to use the Excel Data Analysis add-in descriptive statistics tool.
If you use Microsoft Excel on a regular basis, odds are you work with numbers. Put those numbers to work. Statistical analysis allows you to find patterns, trends and probabilities within your data. In this MS Excel tutorial from everyone's favorite Excel guru, YouTube's ExcelsFun, the 42nd installment in his "Excel Statistics" series of free video lessons, you'll learn how to calculate the coefficient of variation.
If you use Microsoft Excel on a regular basis, odds are you work with numbers. Put those numbers to work. Statistical analysis allows you to find patterns, trends and probabilities within your data. In this MS Excel tutorial from everyone's favorite Excel guru, YouTube's ExcelsFun, the 30th installment in his "Excel Statistics" series of free video lessons, you'll learn how to create a scatter diagram for 2 quantitative variables.
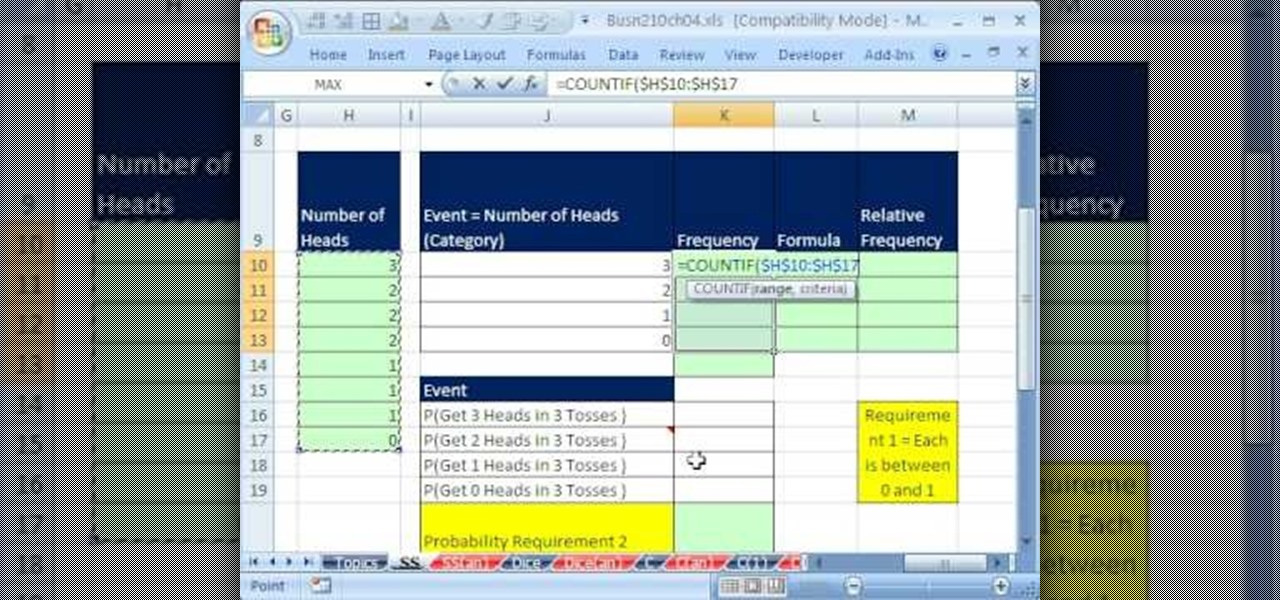
If you use Microsoft Excel on a regular basis, odds are you work with numbers. Put those numbers to work. Statistical analysis allows you to find patterns, trends and probabilities within your data. In this MS Excel tutorial from everyone's favorite Excel guru, YouTube's ExcelsFun, the 51st installment in his "Excel Statistics" series of free video lessons, you'll learn how to understand, work with and find simple probabilities in Microsoft Office Excel.
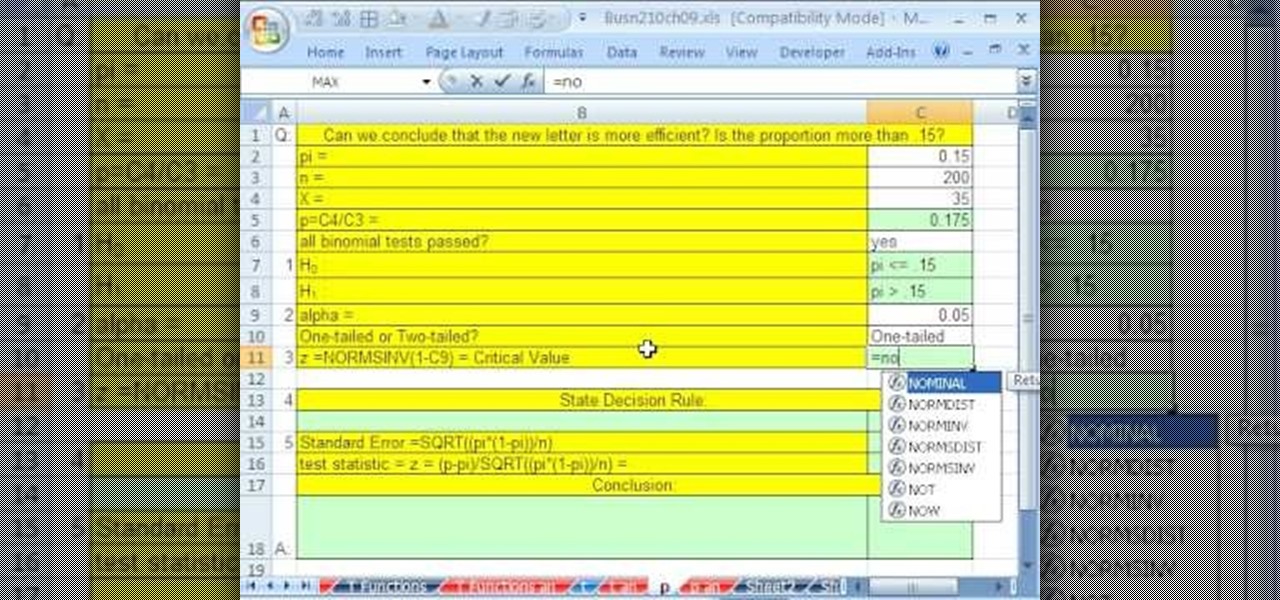
If you use Microsoft Excel on a regular basis, odds are you work with numbers. Put those numbers to work. Statistical analysis allows you to find patterns, trends and probabilities within your data. In this MS Excel tutorial from everyone's favorite Excel guru, YouTube's ExcelsFun, the 93rd installment in his "Excel Statistics" series of free video lessons, you'll learn how to use the NORMSINV and NORMSDIST functions to complete a hypothesis test about a population proportion.
If you use Microsoft Excel on a regular basis, odds are you work with numbers. Put those numbers to work. Statistical analysis allows you to find patterns, trends and probabilities within your data. In this MS Excel tutorial from everyone's favorite Excel guru, YouTube's ExcelsFun, the 83rd installment in his "Excel Statistics" series of free video lessons, you'll learn how to construct confidence intervals when the sigma (population standard deviation) in NOT known using the TINV function.
If you use Microsoft Excel on a regular basis, odds are you work with numbers. Put those numbers to work. Statistical analysis allows you to find patterns, trends and probabilities within your data. In this MS Excel tutorial from everyone's favorite Excel guru, YouTube's ExcelsFun, the 29th installment in his "Excel Statistics" series of free video lessons, you'll learn how to create quantitative data cross tabulation using a pivot table (PivotTable).
If you use Microsoft Excel on a regular basis, odds are you work with numbers. Put those numbers to work. Statistical analysis allows you to find patterns, trends and probabilities within your data. In this MS Excel tutorial from everyone's favorite Excel guru, YouTube's ExcelsFun, the 11th installment in his "Excel Statistics" series of free video lessons, you'll learn how to work with, and create charts for, cross-sectional and time-series data.
If you use Microsoft Excel on a regular basis, odds are you work with numbers. Put those numbers to work. Statistical analysis allows you to find patterns, trends and probabilities within your data. In this MS Excel tutorial from everyone's favorite Excel guru, YouTube's ExcelsFun, the 13th installment in his "Excel Statistics" series of free video lessons, you'll learn how to install the Excel 2007 Data Analysis add-in.
The manicure look in this how-to video walks a line between toughness and polishing, mixing the trend of all black manicures and the classic French tip. All you need is black nail polish and a steady of hand. Learn how to do a french manicure with black tips by watching this video nail care tutorial.
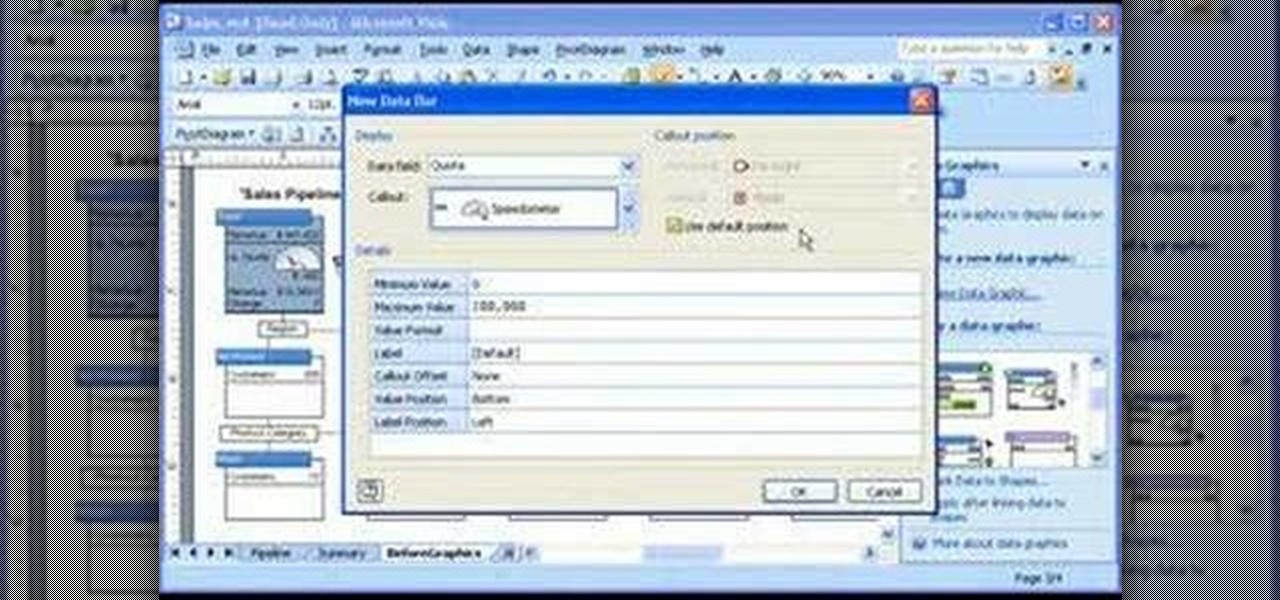
Take a look at this instructional video and learn how to customize progress meters, icons, color coding, and other graphical elements to emphasize sales trends, product performance, critical deadlines, or whatever information is contained in the data behind your diagram.
Over the course of the past century or so, media consumption has gone from a few readers enjoying their local print publication to billions of users viewing countless hours of video across the globe each day. This was a gradual evolution at first, but recent advancements in mobile connectivity have sent us into a climb the likes of which we have never seen before.
There's nothing quite like getting lost in the TikTok void. While you'll likely never run into the same video twice, the same can't be said for popular sounds and fads. Some trends get so viral, it feels like you hear the same song or track every other TikTok. Just know this: you don't have to put up with any trend you're sick of.
The past year brought about a number of trends in the smartphone space. More immersive displays, better processors, and portrait mode for cameras come to mind as big steps forward. One of the most polarizing trends that continued in 2017 is the removal of the 3.5 mm headphone jack from flagship phones. The number of manufacturers that have completely dispensed with wired audio is staggering, so let's run down the full list!
A little fondant and royal icing can go a long way to transform an ordinary cookie into something truly spectacular. At no time is this more true than Christmas, when cookies magically evolve into spectacular creations of snowflakes, Christmas trees, and gingerbread men.
The process of making man - whether you believe we were brought here magically at the whims of an intelligent maker or we evolved slowly from apes over millions of years - was agreeably complex and arduous. Cut the crap and make your own species of miniature humans in a zillionth of the time by watching this video by Jo Nakashima.
Way back when CS3 was introduced, Adobe added video editing capabilities to their flagship image editor. To say the least, people were skeptical. However, now that technology has evolved and folks have had time to see just how far you can push video inside of Photoshop, the possibilities are becoming very exciting. In this installment from his series of free Adobe Photoshop tutorials, Justin Seeley shows you how to create a vintage film effect. For detailed, step-by-step instructions, and to ...
This instructional video, produced by Jewish Pathways, demonstrates how to put on a tallit for Jewish prayers. The tallit (or tallis or tallith) is shawl used for Jewish prayer, worn while reciting morning blessings and well as in the synagogue on Sabbath and holidays.
Mixologist Chris McMillian walks us through the preparation of the Lemon Drop. The Lemon Drop is a classic cocktail which is both sweet and sour and is sure to go down smooth. Originally it was a chilled shot of vodka with a sugar saturated lemon but it has evolved into the delicious drink which it now is.
It looks like the Huawei P20 Pro won't be the only phone with a triple camera for much longer. Rumors indicate the upcoming LG V40 ThinQ will share the same number of cameras. And just like with dual cameras, LG is showing that there is more than one way to arrange them.
Yoshi has evolved from a simple Mario sidekick into one of the most beloved figures in all of gaming. This video will teach you how to translate your love of this perpetually-famished dinosaur into another medium: Legos. Learn how to make a model of Paper Yoshi, from the Paper Mario series, out of Lego blocks by watching this video. The artist here uses a computer program for his demonstration, but you can use real blocks obviously if you have enough of them!
Excel is great, and if you're a Mac user, Excel 2008 for Mac has a lot of new and useful great features you can use to maximize efficiency in your spreadsheets. Excel doesn't have to be the boss anymore, you can! The Microsoft Office for Mac team shows you all the great features in this how-to video.
While printers are not normally considered to be at the leading edge of computer technology, these devices have evolved at a lightning pace over the years. Before today's low cost, high-quality inkjet and color laser printers, we used low-quality dot matrix printers and slow laser printers where quality and performance of printing was often questionable. Additionally, documents that looked correct on screen often came out looking differently on paper, due to differences between what the scree...
Want to be on top of the trends this winter season? Circle scarfs are in now, and they are super easy to make! All you need is two yards of your favorite fabric, then sew it into a tube to create your own scarf.
When it comes to Gossip Girl Blair Waldorf's wardrobe, big hair bows come only second to hairbands for hair accessories. But you don't need to purchase a bunch of hairbands with big bows on top of them to stay on top of the trend.
With feminine florals being one of the hottest spring and summer trends, it's often recommended by the fashion elite - including Tim Gunn - that more masculine elements be included in your outfits to balance out floral girliness.
If you use Microsoft Excel on a regular basis, odds are you work with numbers. Put those numbers to work. Statistical analysis allows you to find patterns, trends and probabilities within your data. In this MS Excel tutorial from everyone's favorite Excel guru, YouTube's ExcelsFun, the 92nd installment in his "Excel Statistics" series of free video lessons, you'll learn how to use the TINV and TDIST functions to test a hypothesis.
If you use Microsoft Excel on a regular basis, odds are you work with numbers. Put those numbers to work. Statistical analysis allows you to find patterns, trends and probabilities within your data. In this MS Excel tutorial from everyone's favorite Excel guru, YouTube's ExcelsFun, the 85th installment in his "Excel Statistics" series of free video lessons, you'll learn how to construct confidence intervals for proportions using NORMSINV function and other formulas.