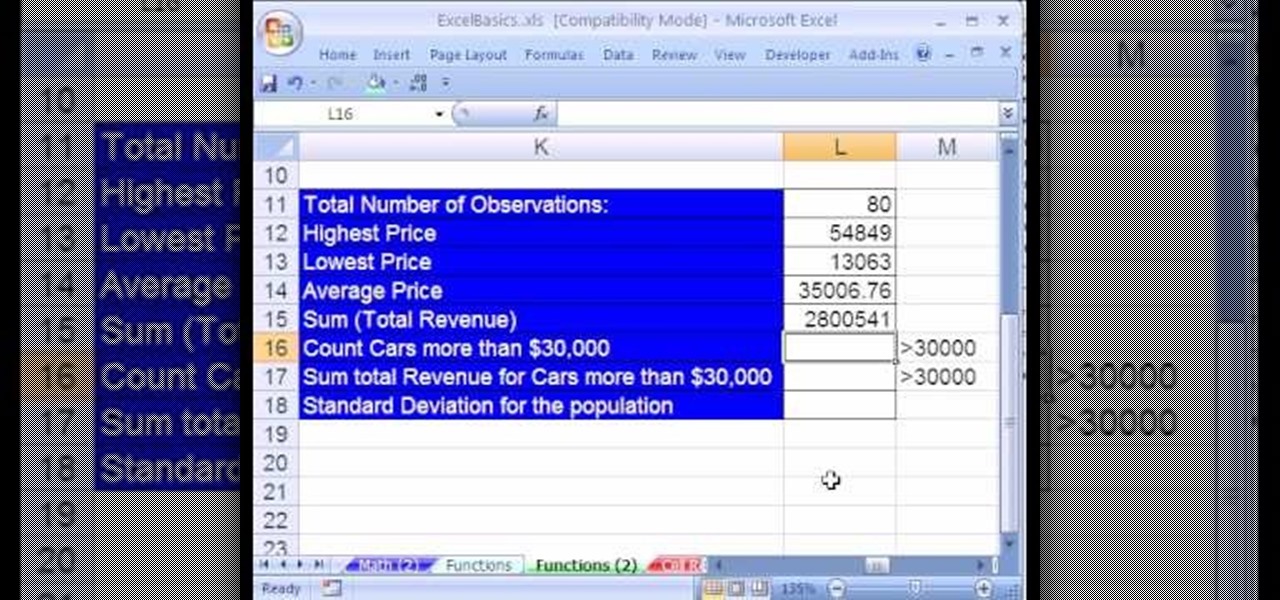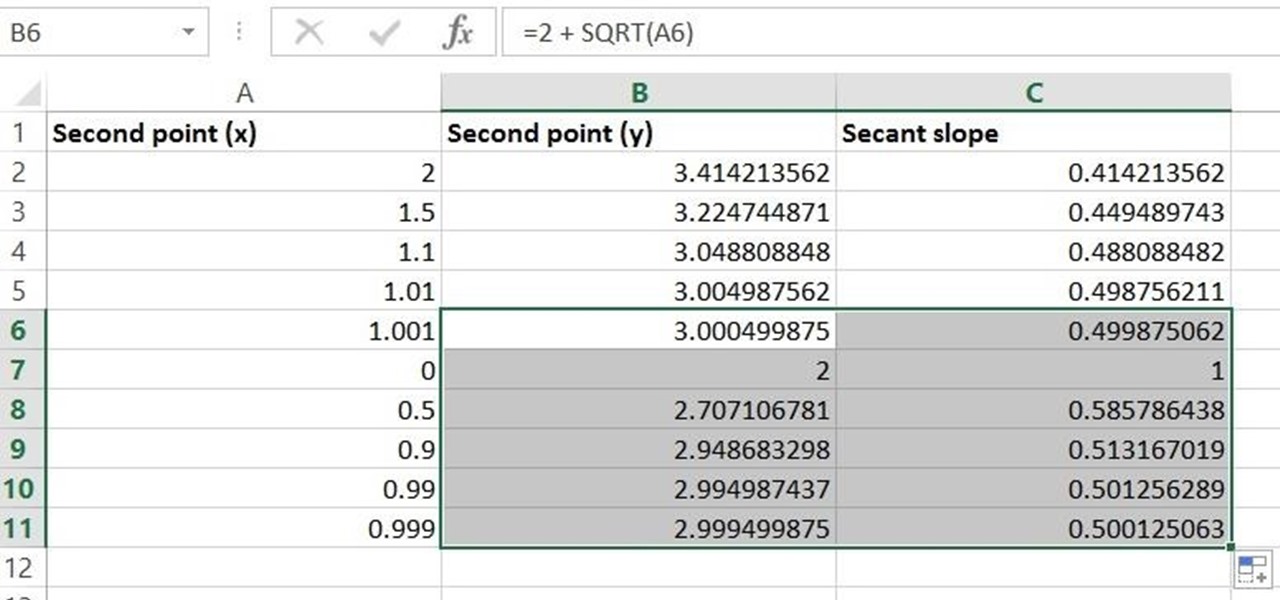
Given a function, you can easily find the slope of a tangent line using Microsoft Excel to do the dirty work. That is to say, you can input your x-value, create a couple of formulas, and have Excel calculate the secant value of the tangent slope. This is a fantastic tool for Stewart Calculus sections 2.1 and 2.2.
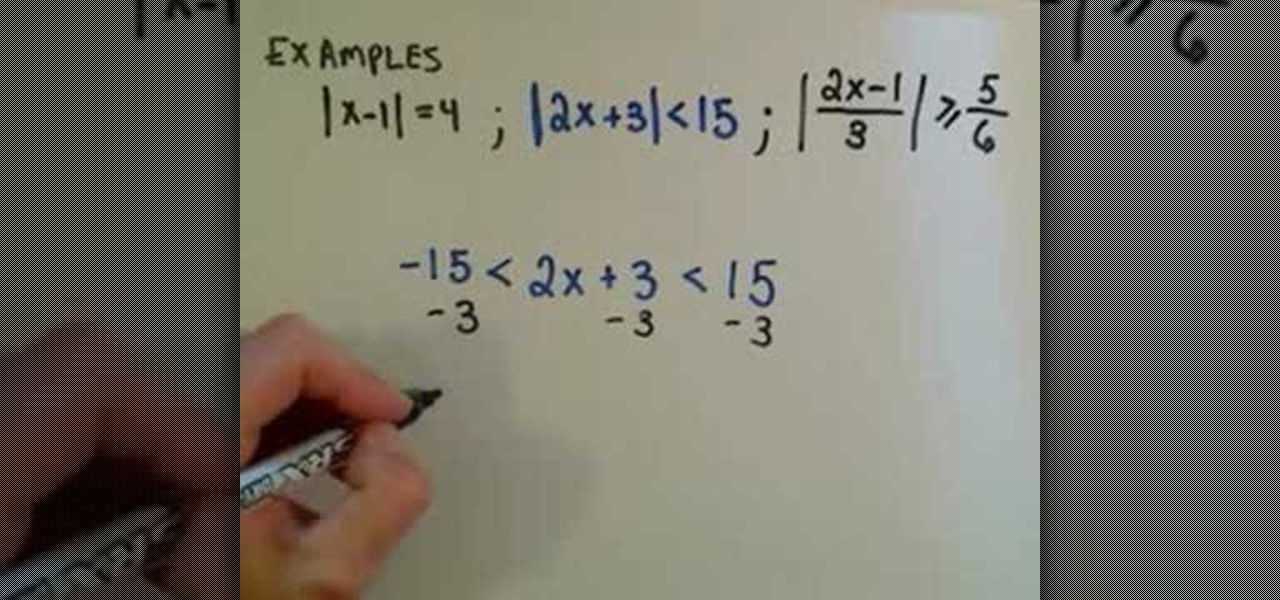
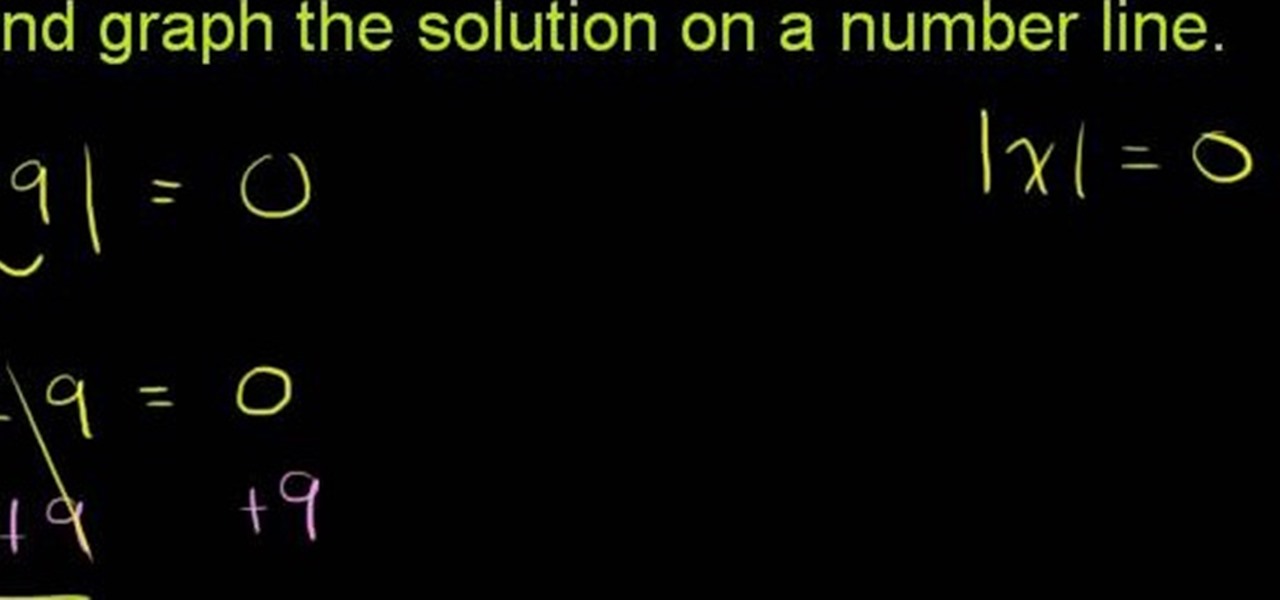
In this video the instructor shows how to solve linear absolute value equations and inequalities. You need to remember basic rules to solve these kind of problems. When the absolute value is equal to a number then the real value of it is equal to either the positive value of that number or negative value of that number. In case the absolute value is less than or equal to a number, then the real value lies in between the positive and negative values of that number. In the third case, if the ab...

In this tutorial the instructor talks about various strategies for solving equations and inequalities involving absolute value. To do this the first step is to isolate an absolute value. An absolute value is exactly equal to a number. If that number is less than zero then there is no solution. So, if you have an absolute value that is less than a number it means that the real value lies in between negative and positive value of that number. If your number is less than zero then it is empty se...
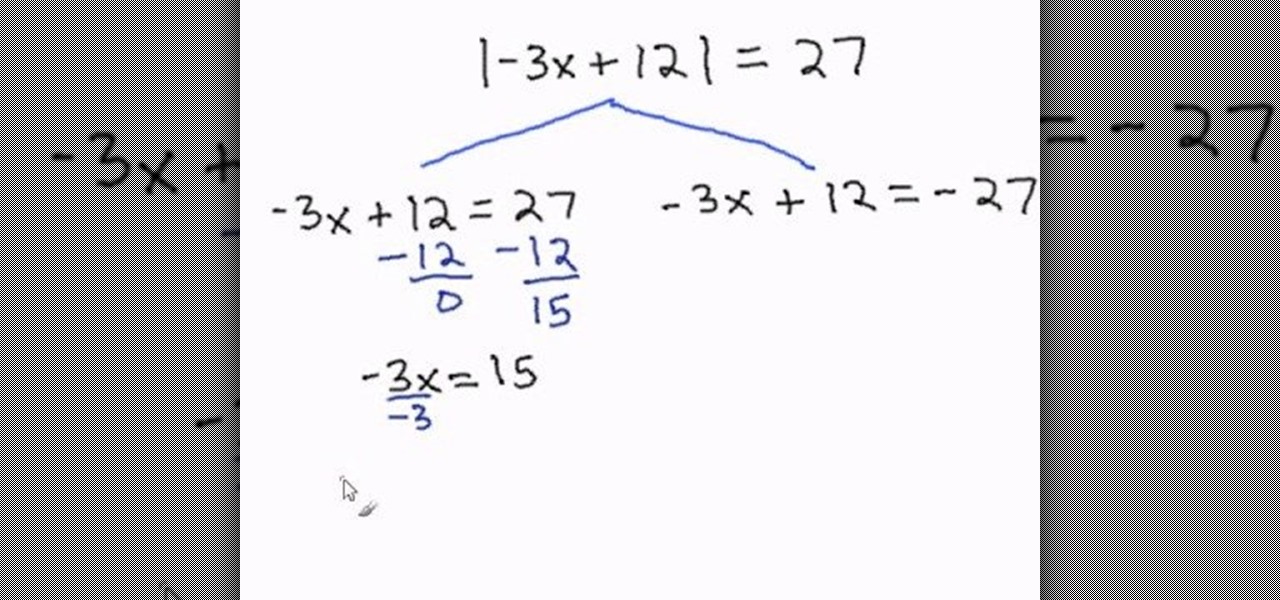
This educational math video describes the steps necessary to solve an equation involving absolute values. "Absolute value" refers to the magnitude of a quantity and is always expressed as a positive number. You can think of absolute value as the distance a number would be from zero if plotted on a number line. Positive 17 and negative 17 both have the same absolute value because both are 17 units from zero on a number line. Because of this, all absolute value problems have two answers, one wh...

Doug Simms gives a demonstration of multiplying fraction in a simple and easy manner. The simplest problems have proper fractions to be multiplied by proper fractions, and the answer can be arrived at by simply multiplying the numerator (upper value) of one fraction with the numerator of the other, carrying out the same operation with the denominators (lower values) of the two fractions, and finally, reducing the resultant fraction by a common factor, if any. Doug also gives three other examp...
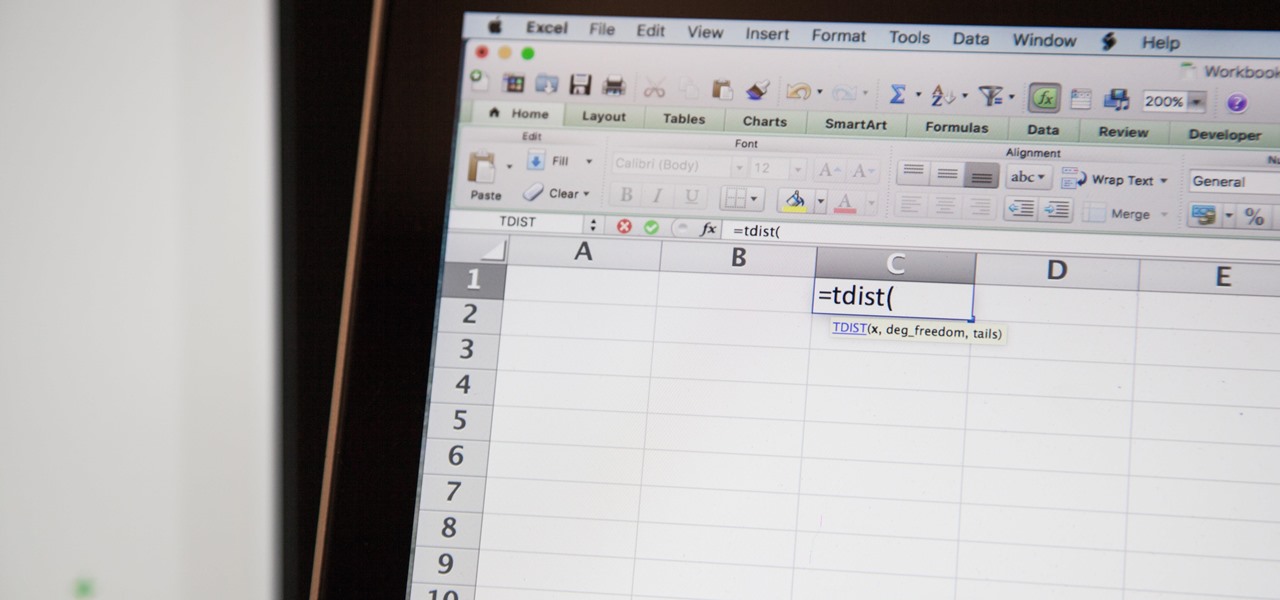
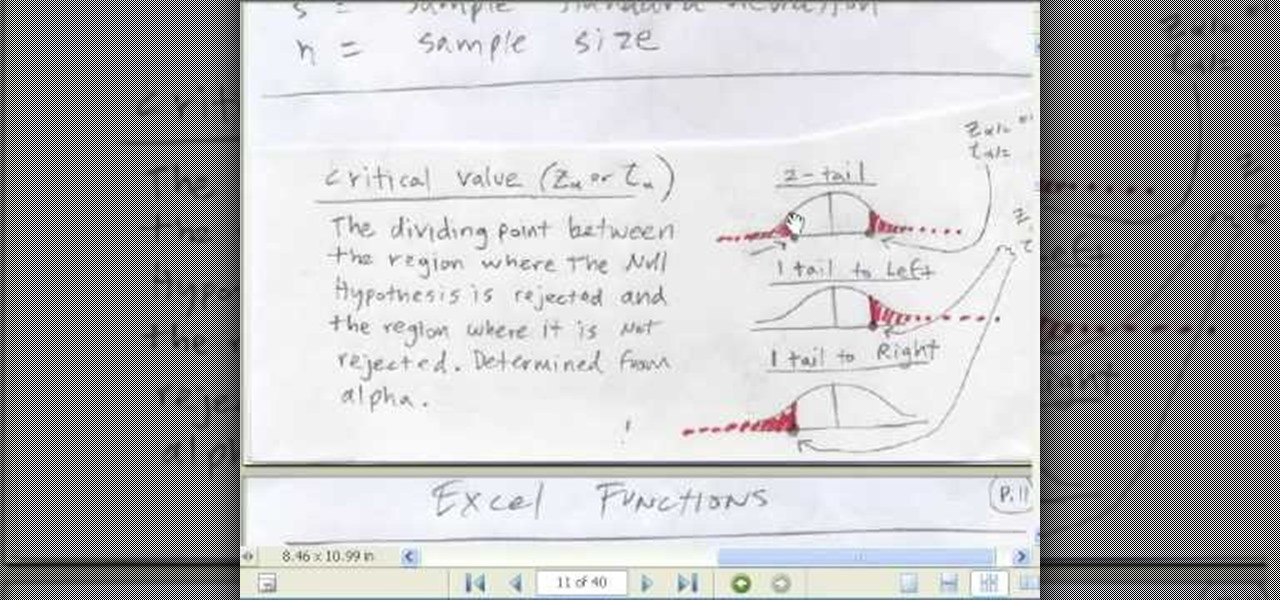
So you need to find the p-value for your hypothesis test. To do so, employ the spreadsheet program Microsoft Excel. Using a simple formula, you can easily determine the p-value for your tests and thereby conclude strong or weak support of the null hypothesis.

Create a table with sales data with this video.

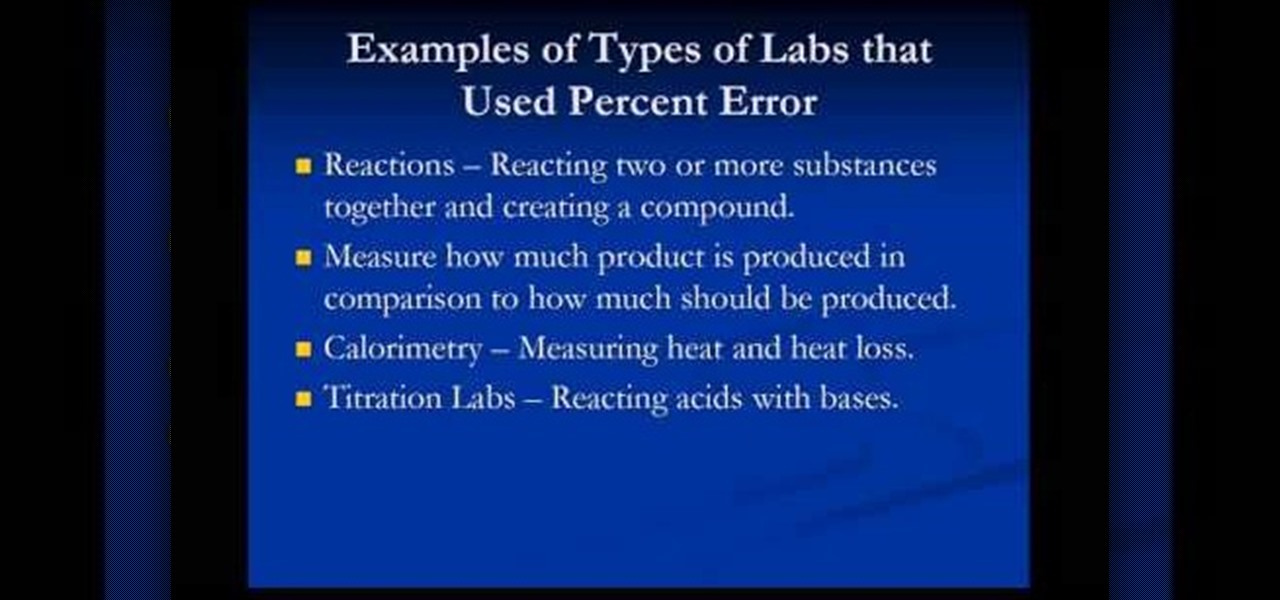
If you want to know how to calculate percent error easily, you should watch this video. Error is the amount of deviation from accurate values. Error calculation is not possible, unless you make a quantitative measurement of the various quantities involved in your experiment. Measurement can help us in calculating errors and knowing how right we are in our theoretical models. In calculating percent error, We need to get the experimental value and the value which you are aiming at, which is the...

Value shapes can be a struggle for an artist to learn, but it's worth the effort. With the right shading and definition, your drawings can really come alive. In this multi-part series, the artist walks you through value shapes for your portraits.

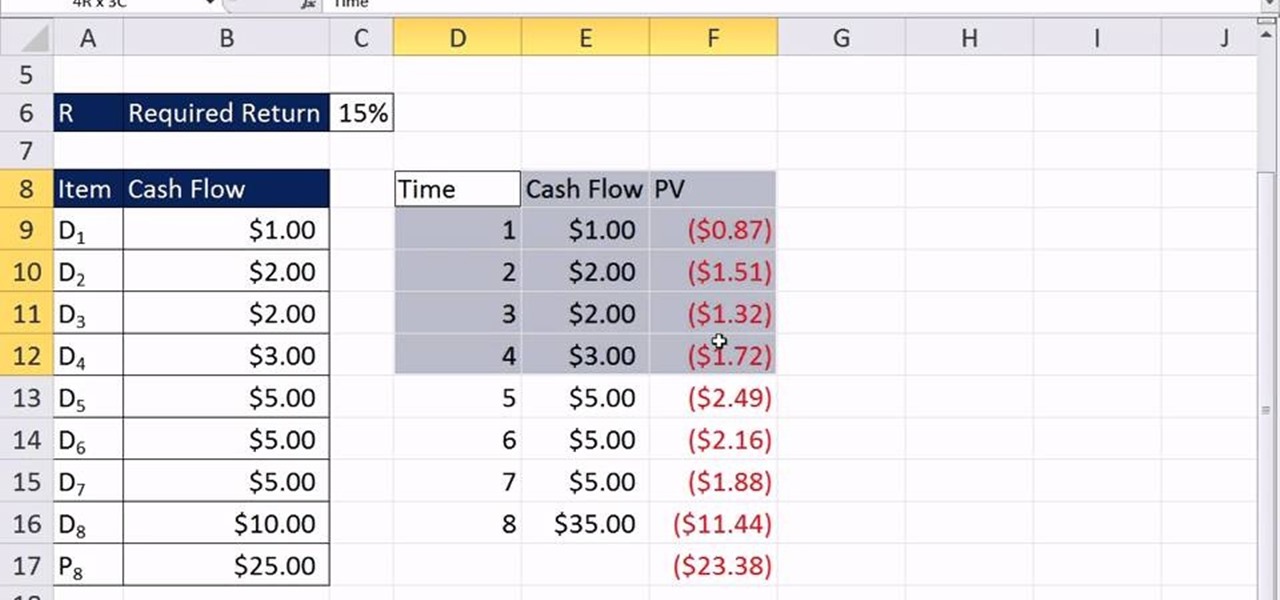
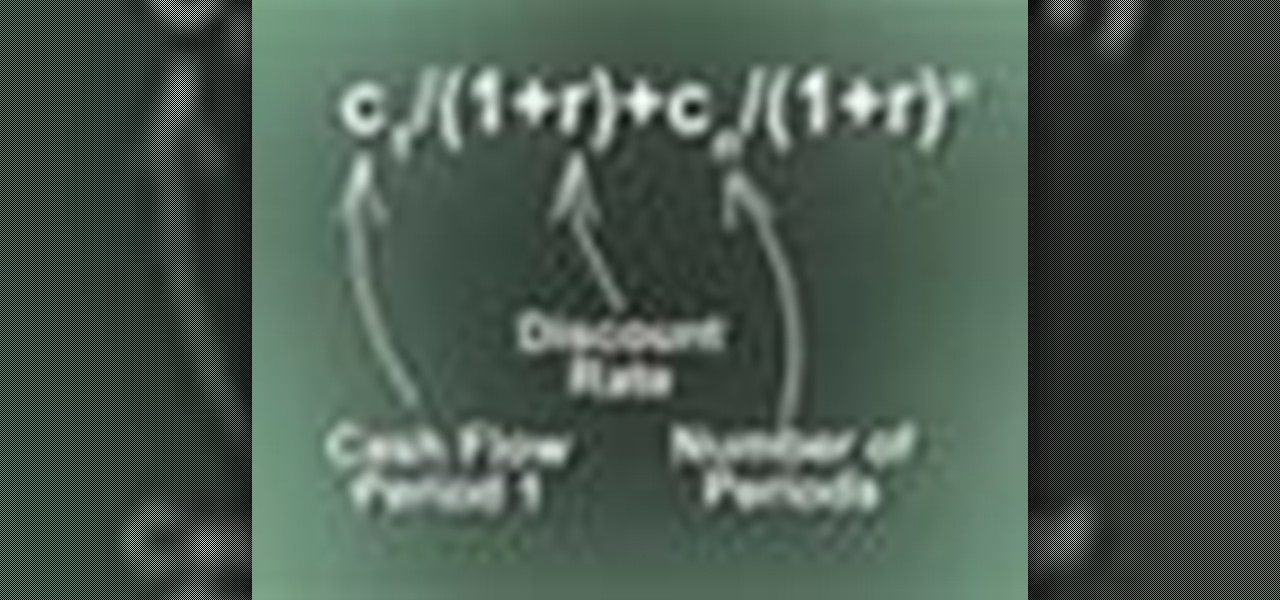
As you might guess, one of the domains in which Microsoft Excel really excels is finance math. Brush up on the stuff for your next or current job with this how-to. In this tutorial from everyone's favorite digital spreadsheet guru, YouTube's ExcelIsFun, the 61st installment in his "Excel Finance Class" series of free video lessons, you'll learn how to calculate the value of a stock based on the present value of a future dividend cash flow.

The 'net present value' is the difference between the initial cost outlay of making a product or an investment, and the present value of expected cash flow. Using the equation given in this video, you can start with the initial estimation and determine the net present value for your endeavor.

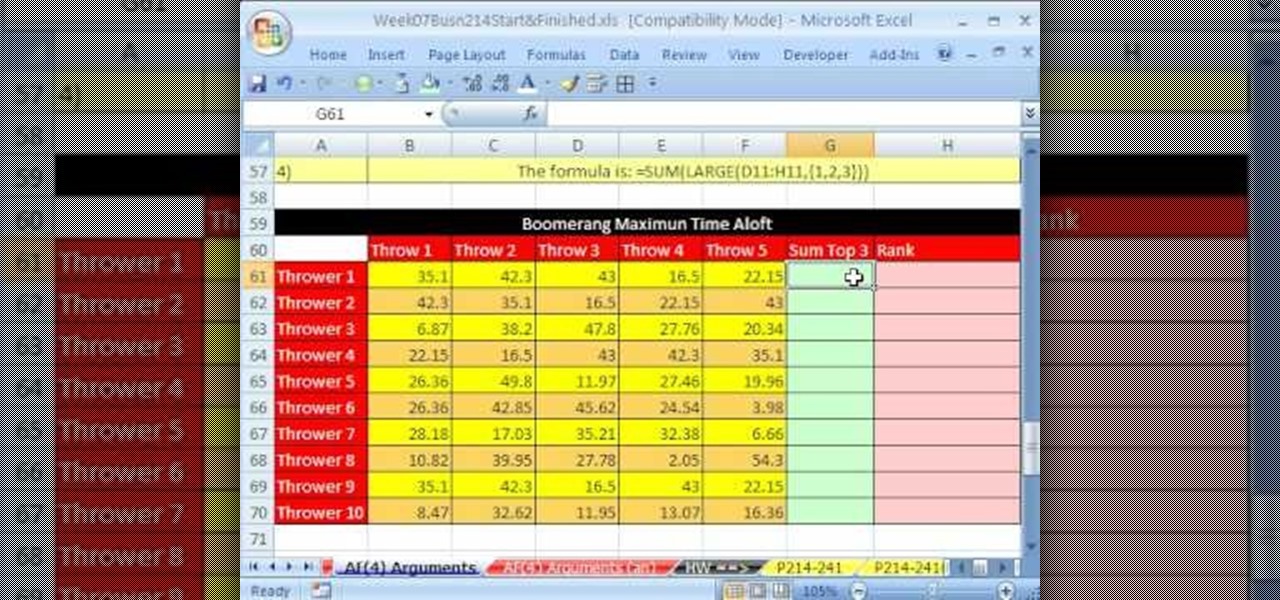
New to Microsoft Excel? Looking for a tip? How about a tip so mind-blowingly useful as to qualify as a magic trick? You're in luck. In this MS Excel tutorial from ExcelIsFun, the 616th installment in their series of digital spreadsheet magic tricks, you'll learn how to use the LARGE and SMALL functions to retrieve the 1st, 2nd, and 3rd largest values from a list. You'll also see how to do each of the following:

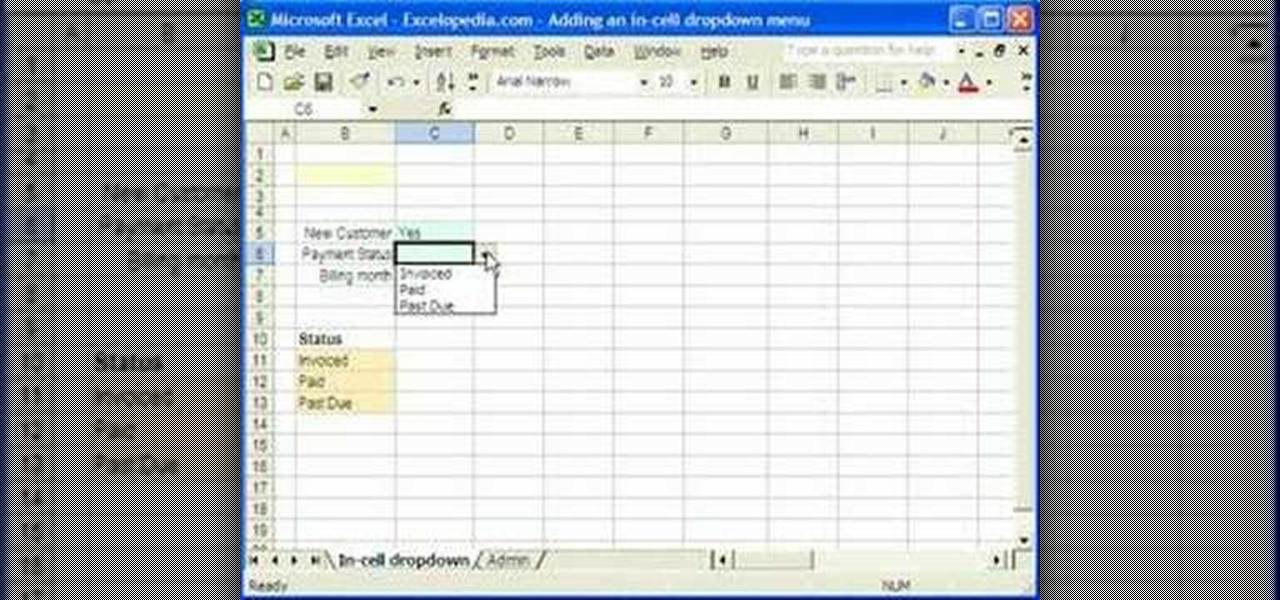
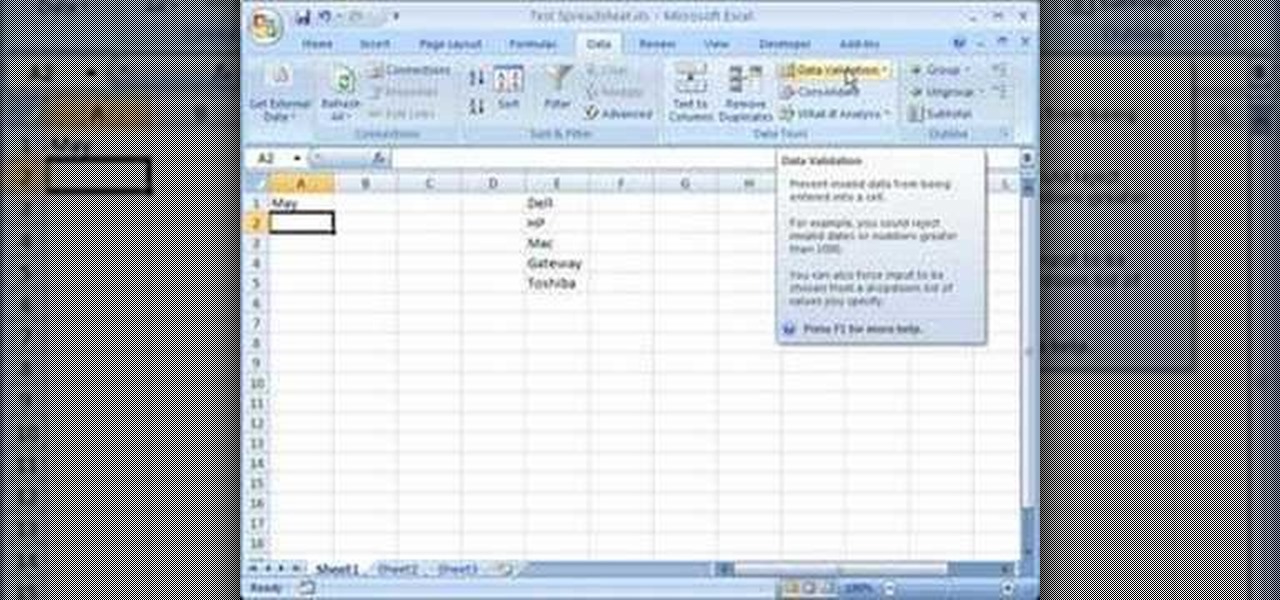
1. Select the cell for which the dropdown menu is to be applied. 2. once the cell is selected goto DATA menu select VALIDATION.Data validation dialog box will be displayed.

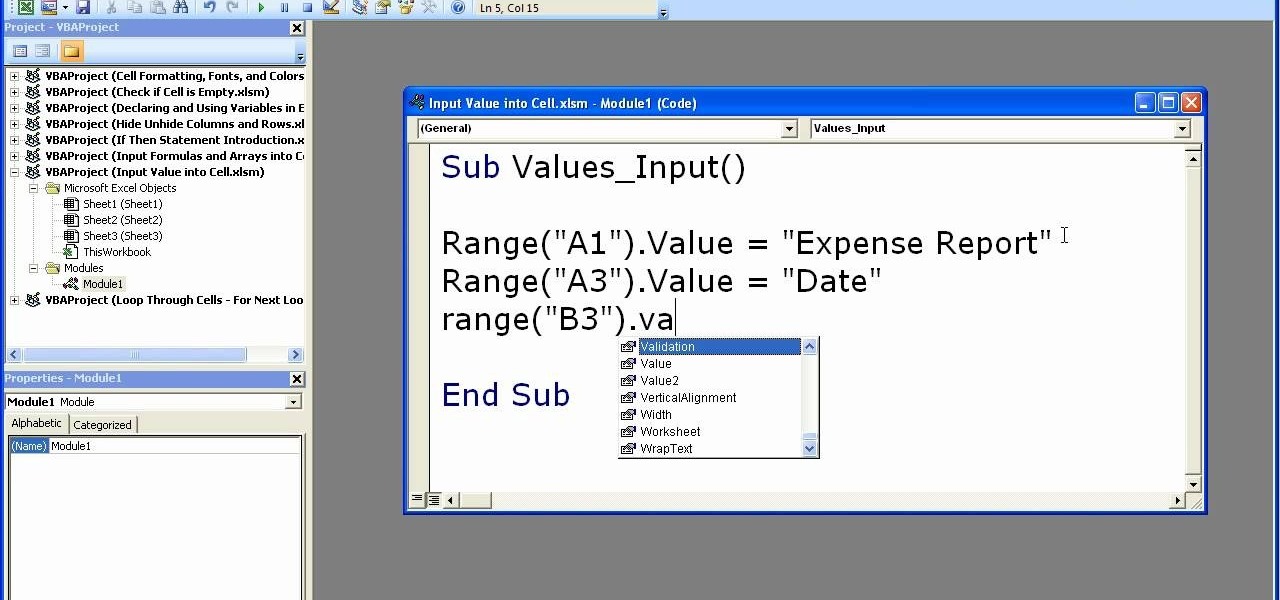
This video shows how to enter values into cells using Excel macros and Visual Basic. This includes a sample Expense Report that is used in this demonstration. In this demonstration, we will create the macro that inputs a title as "Expense Report", Three columns i.e. "Date", "Item" & "Amount", and the summery field as "Total Expenses", as well as the formulas located at the respective cells. Now, we're going to use two keyboard shortcuts i.e. "Alt + F11" to open-up the VBA window and "Alt + F8...

The video demonstrates the way of calculating the interest rates for payday loans using MS Excel. The person presenting the video has got his MS Excel sheet with all the formulas and data ready. He first starts with the nominal & effect & future value tab. He gives us an example where you give the lenders a check of $250 that has a date 25 days in future and get $200 loan today. Now he teaches us hot to calculate APR and EAR. HE has got the data ready there, the period of the loan which is 25...

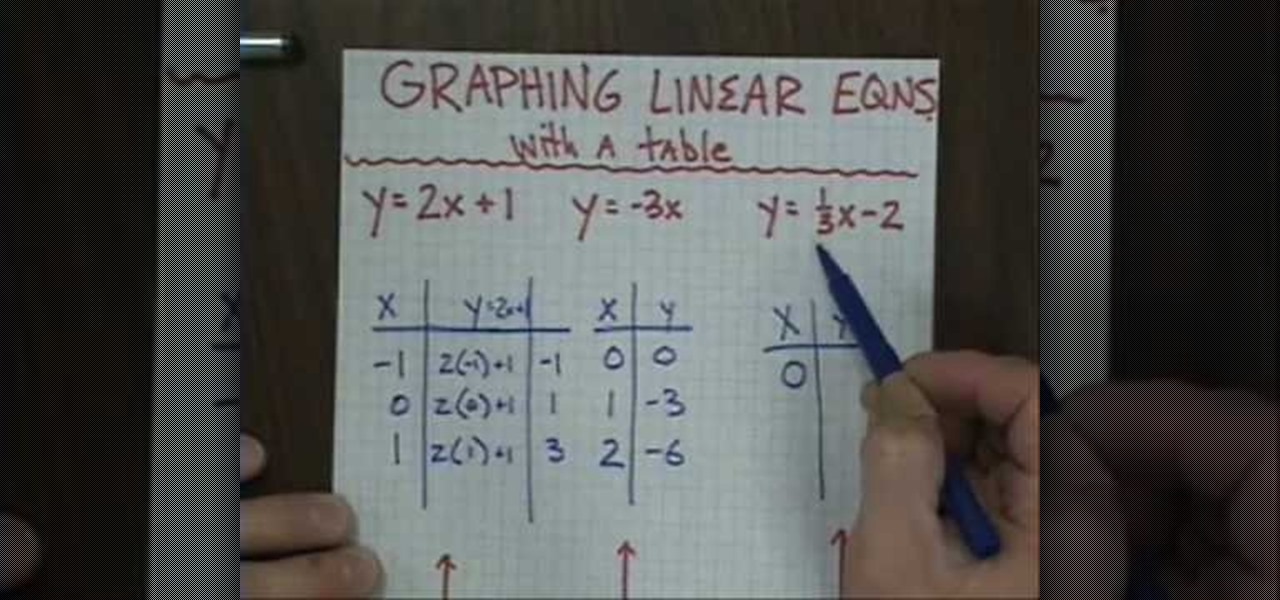
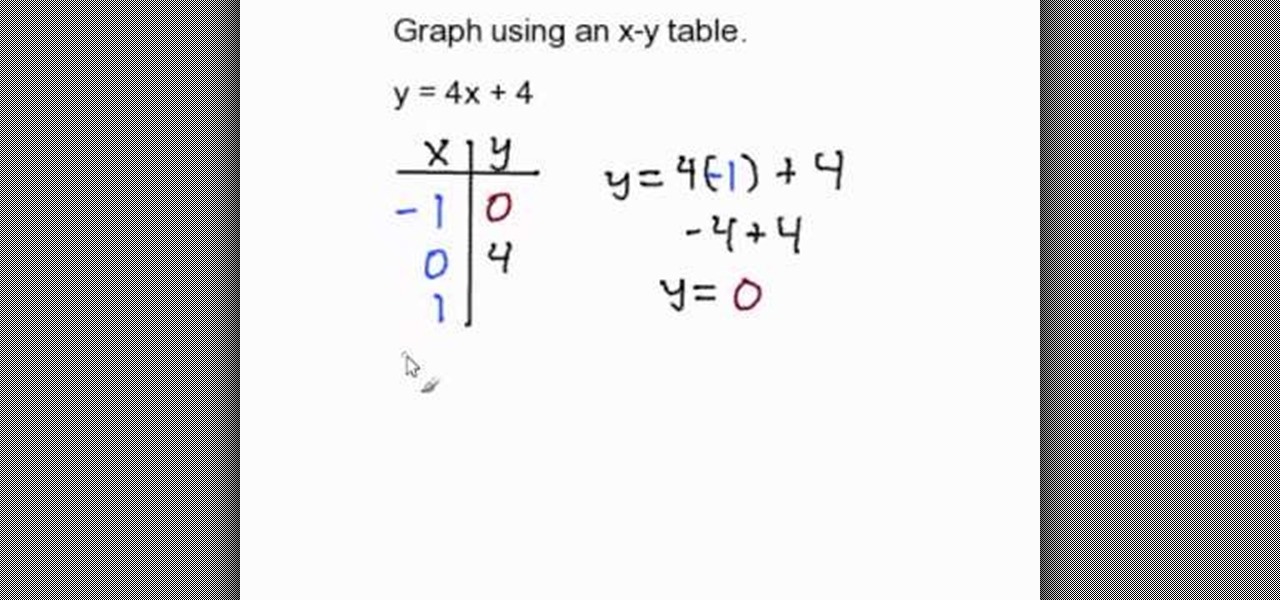
The author teaches us how to graph the linear equations with tables. Given a set of linear equations in terms of "x and y", first we have to draw a table having a column each for x and y. We have to enter an arbitrary value of x in that table and substitute that value in the given equation to get the corresponding y value. Once you obtain both x and y values, the next step is to plot them in a graph. Consider an example: in the linear equation x=2y,on substituting an arbitrary value of x=2,we...

In this video the instructor teaches about direct and inverse variation. Two variables x and y are said to be in direct variation with each other if you can write them in the form y = K * x. The value of y varies directly corresponding to the value of x. Y is said to be directly proportional to x. If you have a sample value of x and y, you can substitute the values in the above equation to compute the value of the constant K. Using this formula you can always find the value of one variable x ...

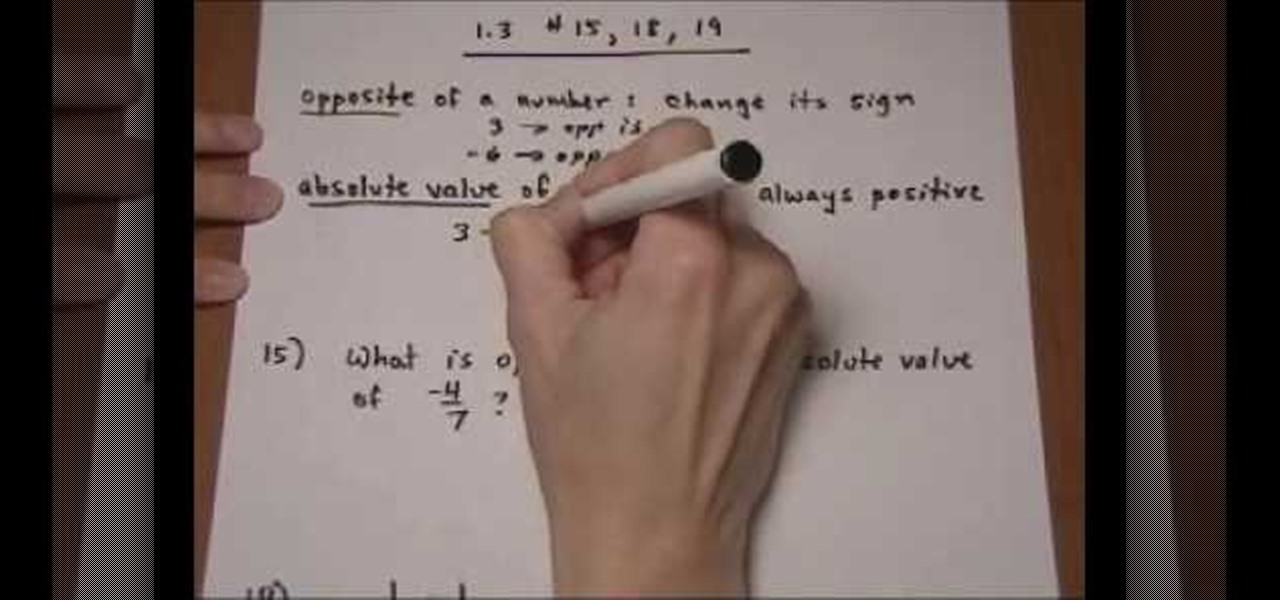
View the absolute value of a number as its distance from zero. When you take the absolute value of a number, you always end up with a positive number (or zero). Whether the input was positive or negative (or zero), the output is always positive (or zero). For instance, | 3 | = 3, and | _3 | = 3 also. This property that both the positive and the negative become positive makes solving absolute-value equations a little tricky. But once you learn the "trick", they're not so bad. Let's start with ...

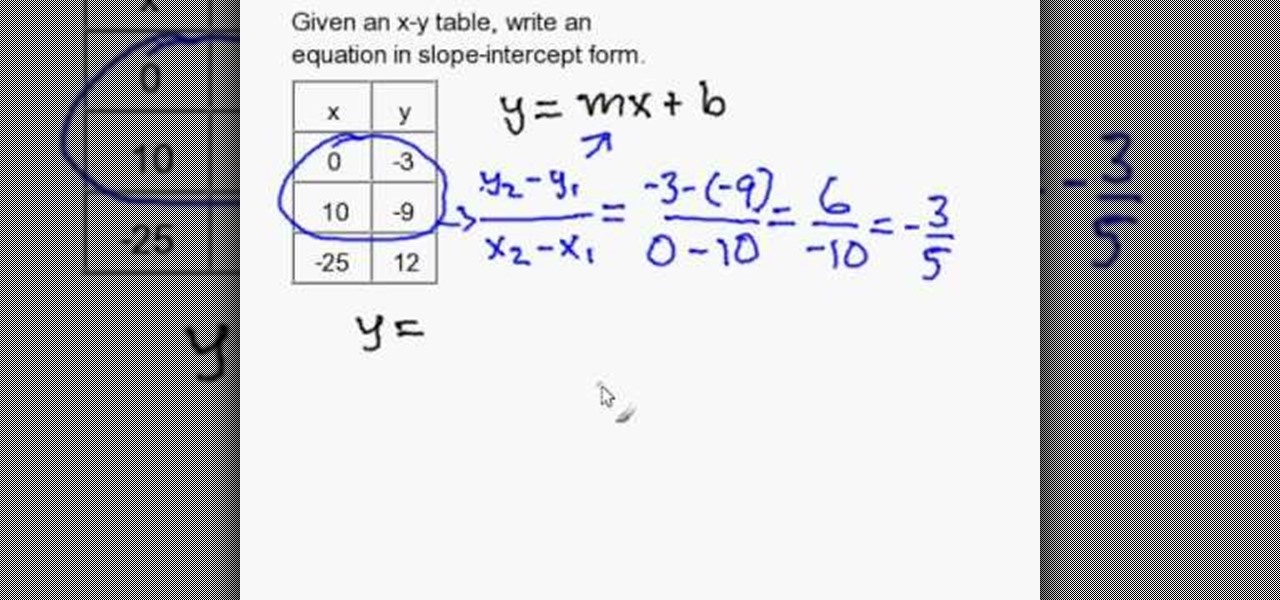
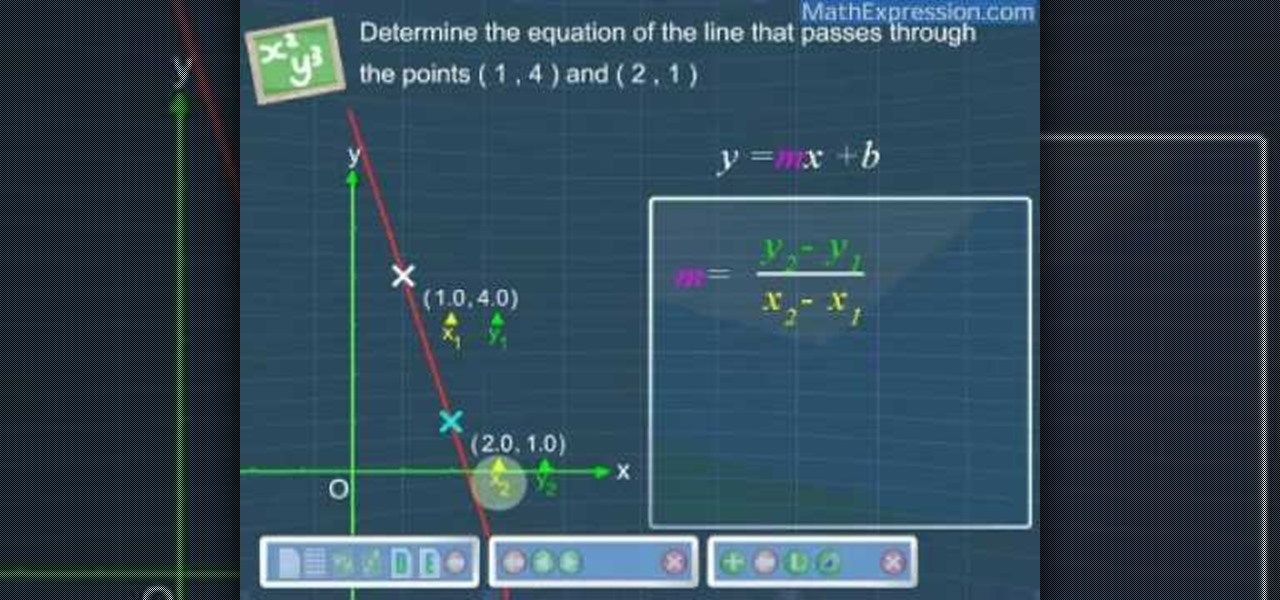
In this tutorial the author shows how to derive a slope-intercept equation of a line given an X-Y table. He explains that the general form of slope intercept form which is y = m*x + b. Now he intends to find value of slope, i.e. m first. Now slope is change in y over change in x. He computes the slope using the X-Y values from the table. Next he substitutes a pair of x, y value in the equation to compute the value of y intercept b. Now finally substituting the values in the equation the slop-...

If you're just getting started in photography or if you're looking to learn a little bit more about your camera, then you may have run into the term "Aperture" or "Aperture Values", or those weird number numbers. Aperture is in the lens of your camera and determines how much light enters into the lens itself and helps to determine your focal length. In this video you will get a small lesson on what Aperture is, and how to calculate focal length and aperture values.

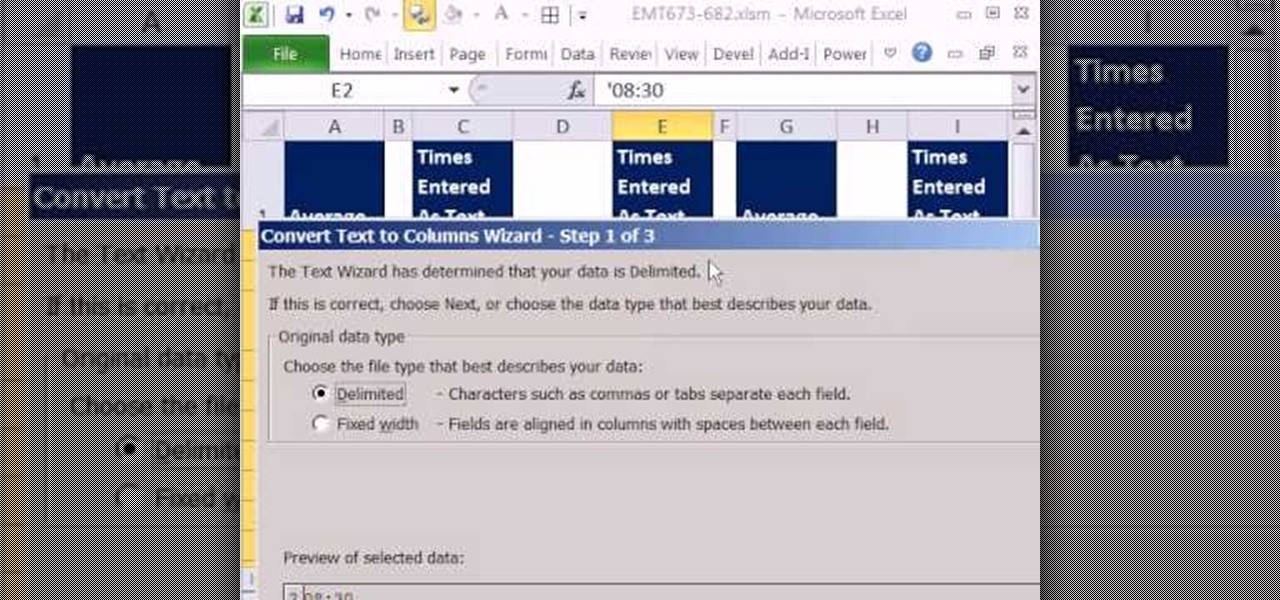
New to Microsoft Excel? Looking for a tip? How about a tip so mind-blowingly useful as to qualify as a magic trick? You're in luck. In this MS Excel tutorial from ExcelIsFun, the 682nd installment in their series of digital spreadsheet magic tricks, you'll learn how to to average times values that were exported from a database as text values instead of number values.

From Ramanujan to calculus co-creator Gottfried Leibniz, many of the world's best and brightest mathematical minds have belonged to autodidacts. And, thanks to the Internet, it's easier than ever to follow in their footsteps (or just finish your homework or study for that next big test). With this installment from Internet pedagogical superstar Salman Khan's series of free math tutorials, you'll learn how to solve absolute value inequalities in algebra.

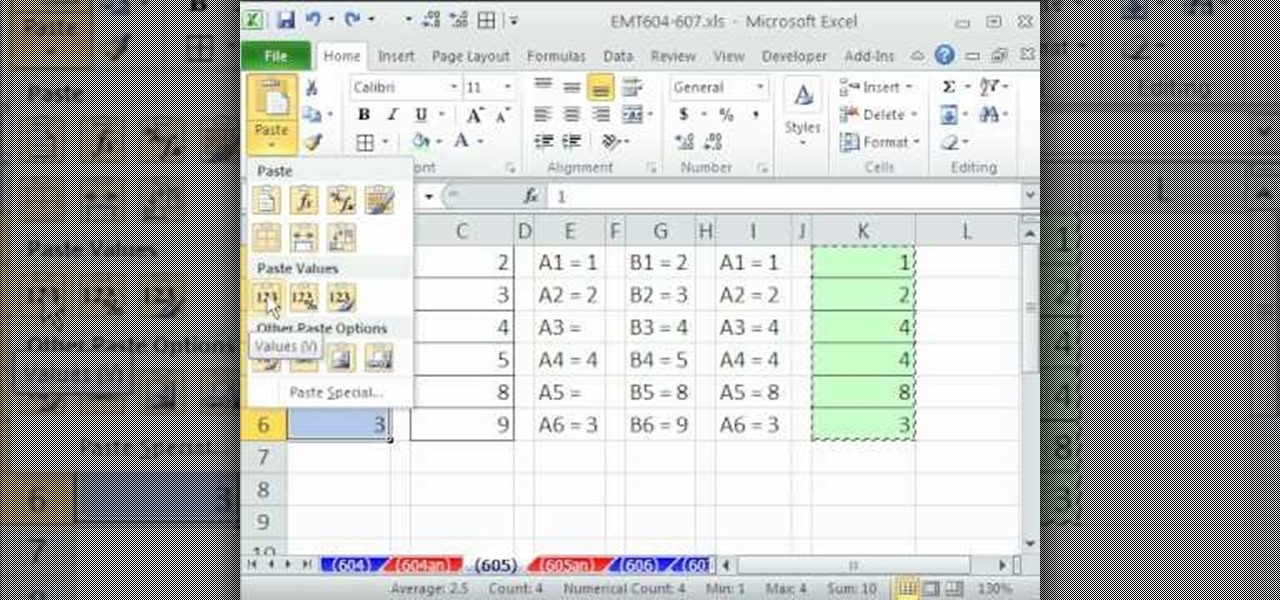
New to Microsoft Excel? Looking for a tip? How about a tip so mind-blowingly useful as to qualify as a magic trick? You're in luck. In this MS Excel tutorial from ExcelIsFun, the 605th installment in their series of digital spreadsheet magic tricks, you'll learn how to use the IF function to fill in column with missing values then use Paste Special Values to create the final column with correct values. Also see three methods for Paste Special Values.

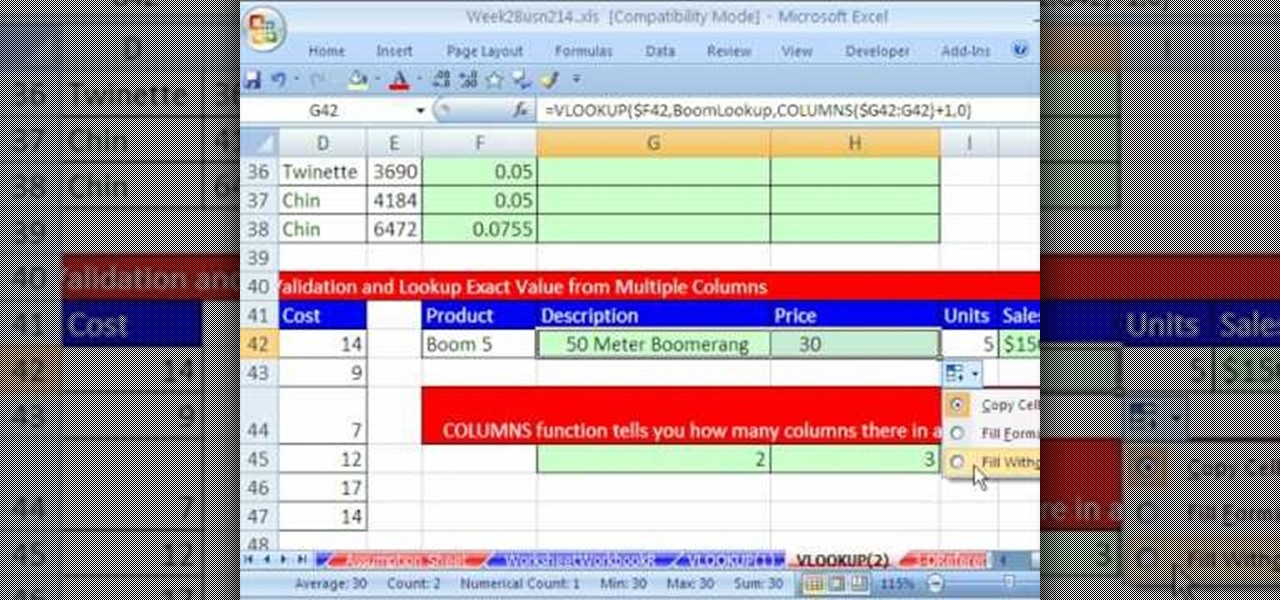
Whether you're interested in learning Microsoft Excel from the bottom up or just looking to pick up a few tips and tricks, you're in the right place. In this tutorial from everyone's favorite digital spreadsheet guru, ExcelIsFun, the 7th installment in his "Highline Excel Class" series of free video Excel lessons, you'll learn how to work with VLOOKUP function formulas in MS Excel. Specifically, you'll see the following:

Sessions Online School of Fine Arts brings you this tutorial video on painting. Search WonderHowTo for Sessions Online School of Fine Arts for more art tutorials. This video art lesson demonstrates how to use color as value in the art of portrait painting.

Learn basic techniques of creating value steps using graphic pencil. Great for art and design foundation students.

This video is a tutorial on how to create drop-down menus in Excel 2007. Select a cell on your spreadsheet and click on the “Data” tab. Go to the “Data Tools” section and select “Data Validation”. In the window that opens select "Allow" and choose "List". You will create a list of the values you want to allow. Type in the values, separated by commas, and click OK. Now you will see your selected cell has an icon to right that indicates there is a drop-down menu containing the value...

Learn how to determine the equation of a line with this tutorial: The equation of a line can be determined by two given conditions.

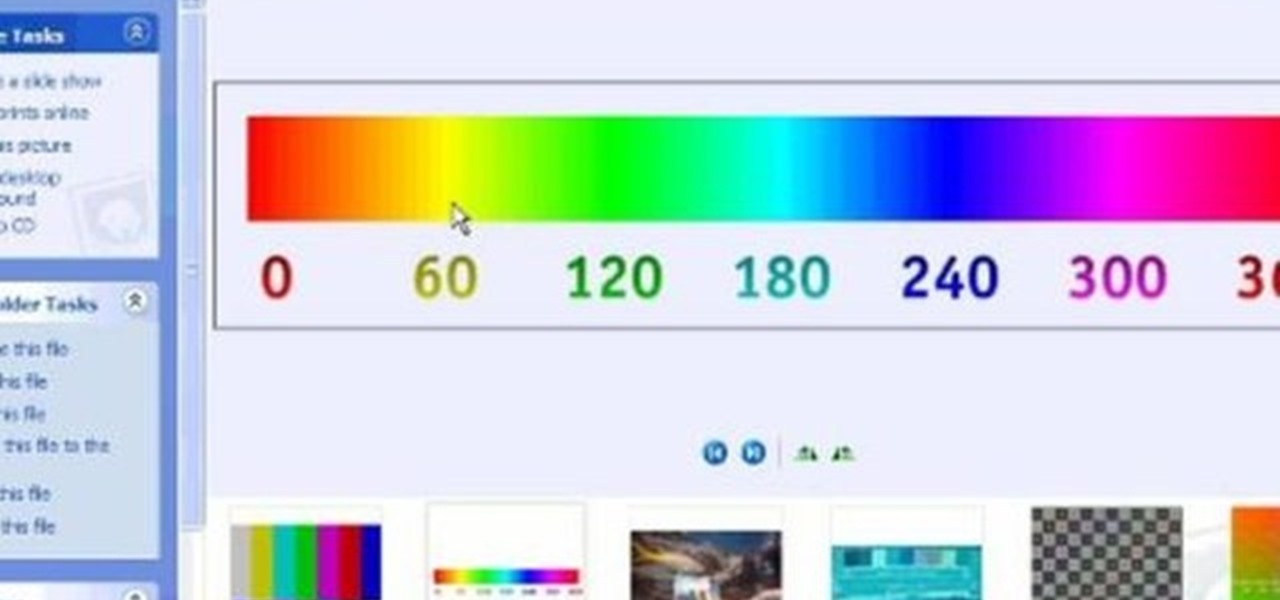
This clip talks about what Hue Saturation Value is, and how to use Blender and the HSV node to isolate a specific color or range of values from an image. Whether you're new to the Blender Foundation's popular 3D modeling program or a seasoned graphic artist just interested in better acquainting yourself with the application, you're sure to be well served by this free video tutorial. For more information, including detailed instructions, take a look!

Looking for a guide on how to solve absolute value equations in algebra? See how it's done with this free video math lesson. Need help finding the From Ramanujan to calculus co-creator Gottfried Leibniz, many of the world's best and brightest mathematical minds have belonged to autodidacts. And, thanks to the Internet, it's easier than ever to follow in their footsteps (or just finish your homework or study for that next big test). With this installment from Internet pedagogical superstar Sal...

Whether you're interested in learning Microsoft Excel from the bottom up or just looking to pick up a few tips and tricks, you've come to the right place. In this tutorial from everyone's favorite digital spreadsheet guru, ExcelIsFun, the 39th installment in his "Highline Excel Class" series of free video Excel lessons, you'll learn how if an array or range is put into a function argument that is expecting a single value, the function becomes an array and delivers an array of values instead o...

If you use Microsoft Excel on a regular basis, odds are you work with numbers. Put those numbers to work. Statistical analysis allows you to find patterns, trends and probabilities within your data. In this MS Excel tutorial from everyone's favorite Excel guru, YouTube's ExcelsFun, the 89th installment in his "Excel Statistics" series of free video lessons, you'll learn how to use the NORMSINV function for critical values and the NORSDIST function for p-values.

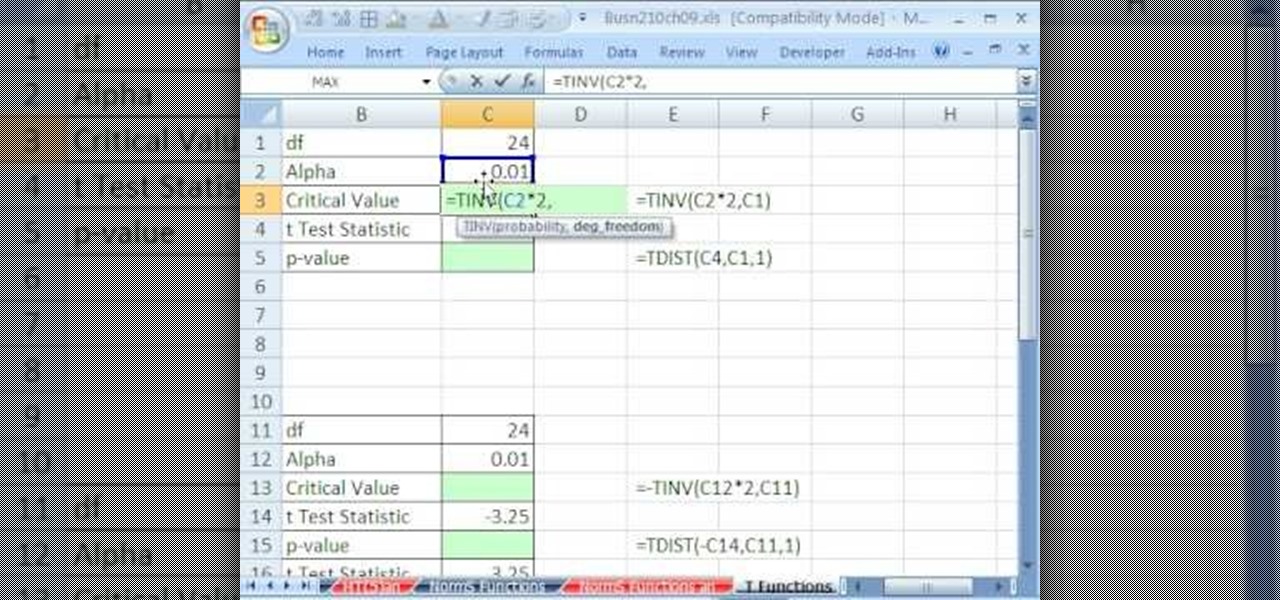
If you use Microsoft Excel on a regular basis, odds are you work with numbers. Put those numbers to work. Statistical analysis allows you to find patterns, trends and probabilities within your data. In this MS Excel tutorial from everyone's favorite Excel guru, YouTube's ExcelsFun, the 91st installment in his "Excel Statistics" series of free video lessons, you'll learn how to use TINV and TDIST functions to find critical values given an unknown sigma value.

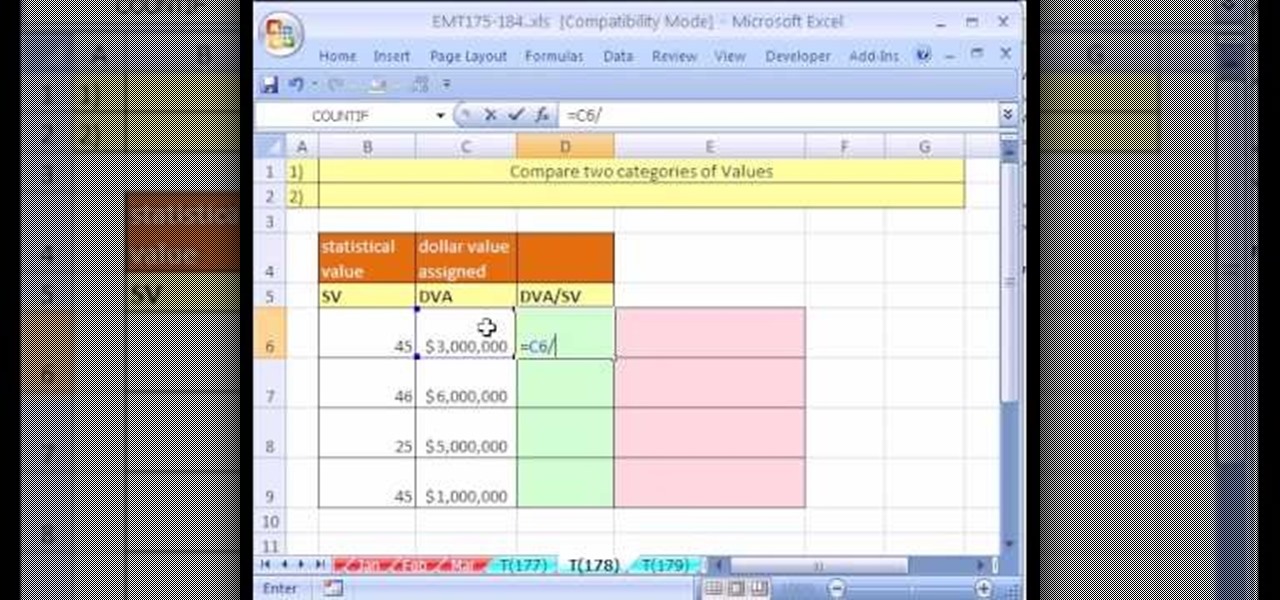
New to Microsoft Excel? Looking for a tip? How about a tip so mind-blowingly useful as to qualify as a magic trick? You're in luck. In this MS Excel tutorial from ExcelIsFun, the 178th installment in their series of digital spreadsheet magic tricks, you'll learn how to alculate the best value from two categories of values.

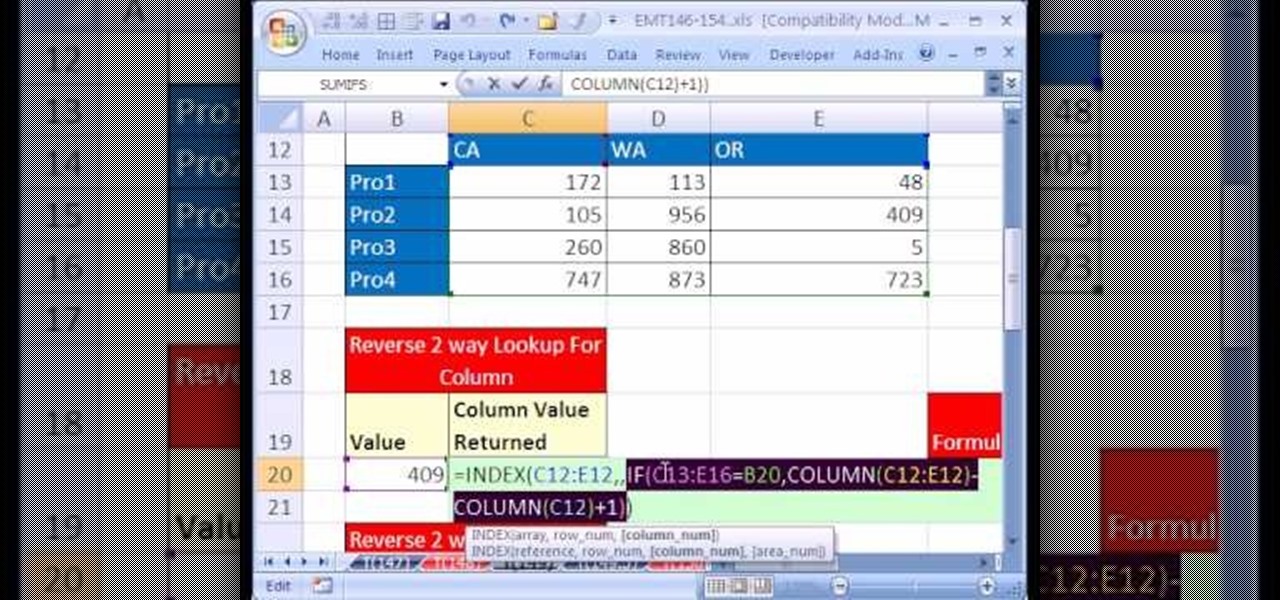
New to Microsoft Excel? Looking for a tip? How about a tip so mind-blowingly useful as to qualify as a magic trick? You're in luck. In this MS Excel tutorial from ExcelIsFun, the 149th installment in their series of digital spreadsheet magic tricks, you'll learn how to take a value in a table and then return the row or column value when there are no duplicate values.

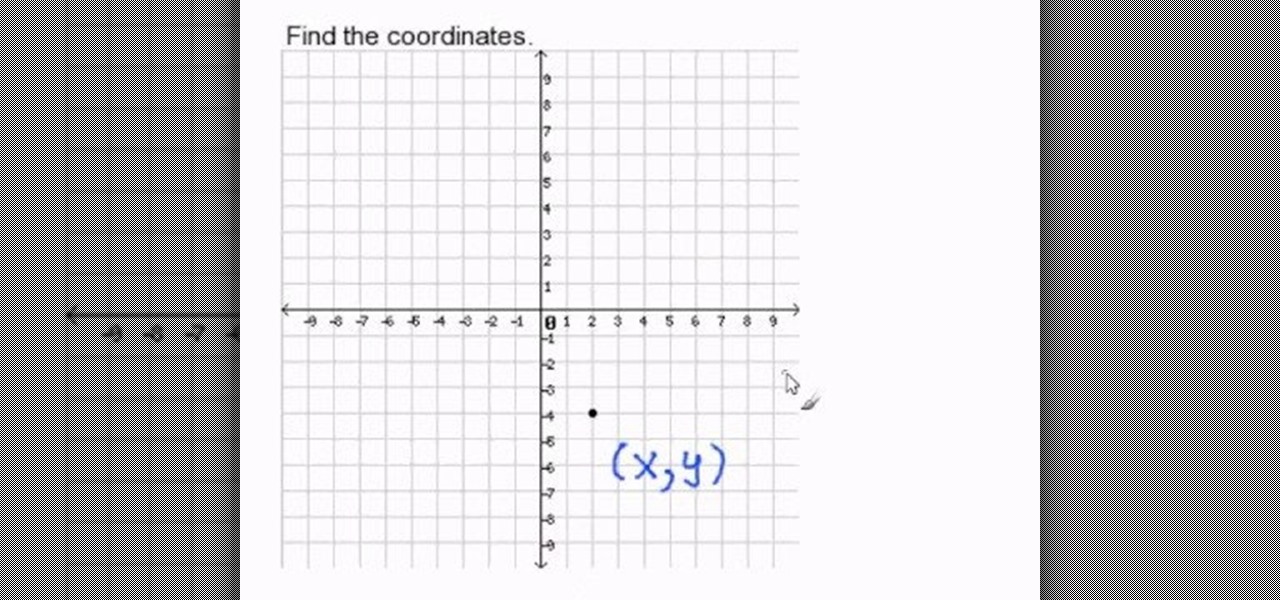
This video tells you how to identify the coordinates of an ordered pair from a given point. An ordered pair is denoted by (x, y). Normally a graph has two axis, the x and the y axis. Consider a point on the graph. It will surely be the intersection of two values and one value will be from the x axis and the other valve from the y axis. Find the two corresponding values of the given intersection point. The value on the x axis will be x and the value from the y axis will be y. Now you have got ...

In this video the author shows how to graph using an X-Y table. He shows how to do this with a sample equation. He builds a table of x, y values where he takes sample values for x like -1, 0, 1 and now he substitutes these values in the equation of the line and obtains the corresponding y values. Now finally he has an x, y value table which now he shows how to plot it on a coordinate plane. He plots all the three pairs on the graph and connects them with a line finally obtaining the resultant...

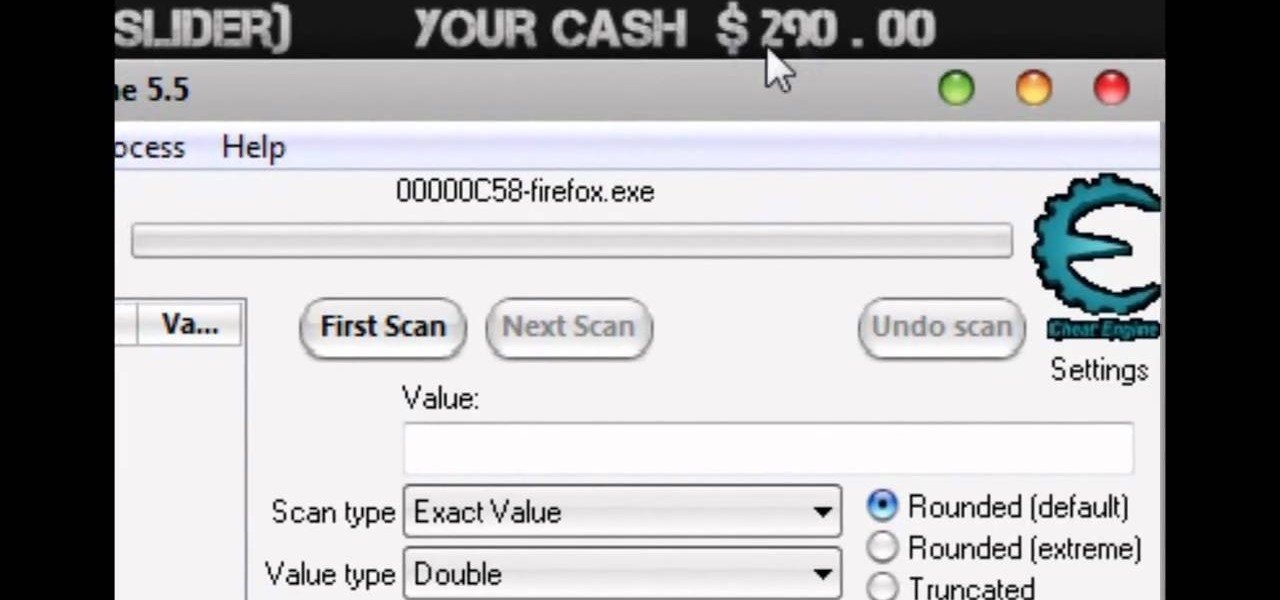
In this video tutorial, viewers learn how to hack the flash game, Palisade Guardian 2: Modern Combat with Cheat Engine. Begin the game by entering your name and play the first level. After that, open up Cheat Engine and select your internet in the process list. Change the Value Type to Double and Truncated to Rounded (default). Enter in the value of your cash and press First Scan. Then buy something to lower your cash and enter in your new value. There should be only 1 address. Check the froz...

In this tutorial, we learn how to write a values statement. First, you will need to think of five to seven values that are important. Make sure these are more than one word and are shared ideas by everyone. There shouldn't be more than seven values, so everyone can remember them. The point is that everyone has values, find something that everyone has in common and guides your behavior as an organization. It may be in your mission statement, but don't worry about it, think of separate statemen...

In this video tutorial, viewers learn how to hack the flash game, Age Of War 2. Users will need to download the Cheat Engine program for this process. Begin by starting the game. The game should start with 2500 gold. Then pause the game and open Cheat Engine. Click on the Process computer icon and select the current web browser. Now type "@500" into the Value box and click First Scan. Then deduct your amount of gold, type in the new value and click on Next Scan. There should only be 1 result ...


