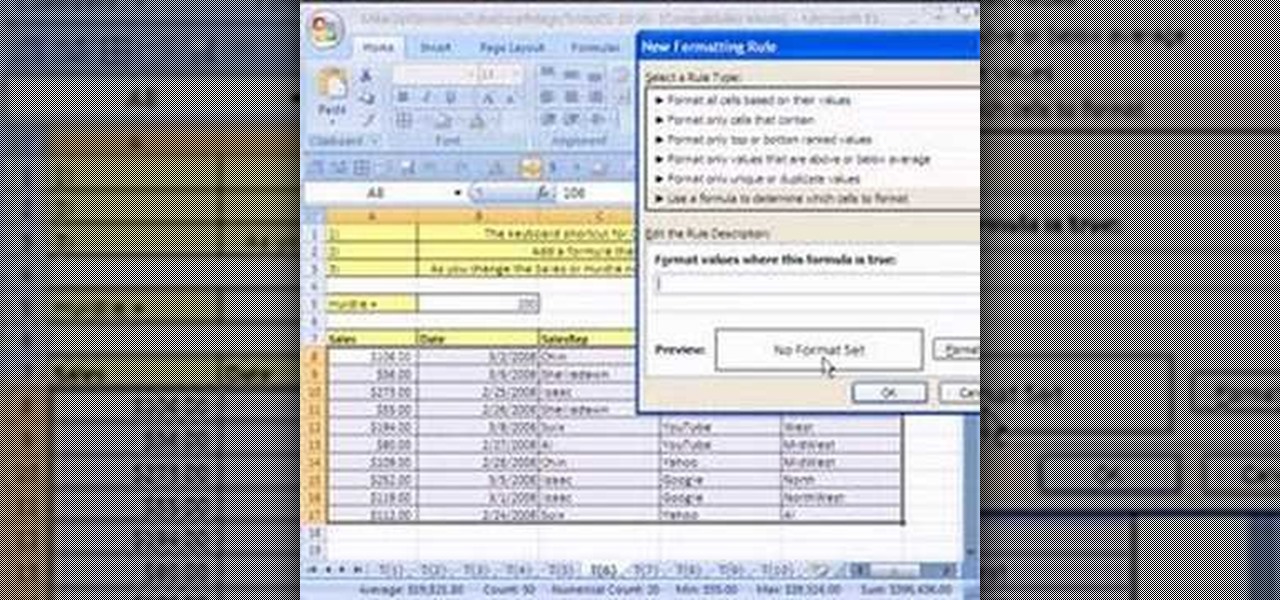
New to Microsoft Excel? Looking for a tip? How about a tip so mind-blowingly useful as to qualify as a magic trick? You're in luck. In this MS Excel tutorial from ExcelIsFun, the 255th installment in their series of digital spreadsheet magic tricks, you'll learn how to create a two-variable data table in Excel for what-if analysis. See the PMT function and learn about the formula equivalent to a data table.
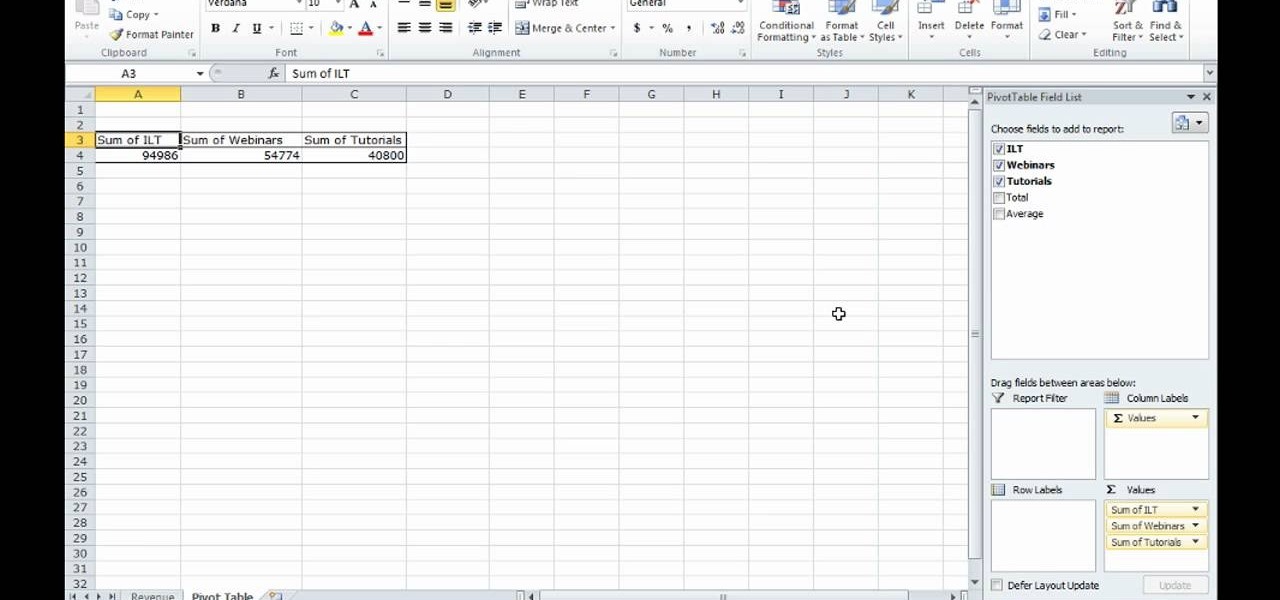
This video shows how to make a quick pivot table data filtering by using Excel 2010's ‘Slicer’ functionality. ‘Slicer’ delivers enhanced visual filtering method to allow you to get the data you need more quickly. When selecting a cell in the pivot table you will find ‘Slicer’ in the filter group of the ‘Insert’ tab. Click on ‘Slicer’ and an 'Insert Slicer' dialogue shows up where you can pick particular data fields from the slider list. Once you click on ‘OK’, the ‘Slicer’ objects with filter...

Data thieves don't have to be programming wizards to get their hands on your personal information. They often find hard drives that contain financial and other sensitive data at flea markets, charity shops, the city dump—even on eBay. In this video tutorial, PC World explains how to completely erase sensitive data from old drives before recycling or discarding them. Wipe your old hard drives with this how-to.

Our future technology has a lot of amazing possibilities, and few have more promise than augmented and mixed reality headsets. But these advancements come with several concerns over privacy, and if we don't understand them, we may lose control of our own data without even knowing.

Not every client or coworker likes to mine through a spreadsheet to find all the important data. So, with Excel 2008 for Mac, you can easily share that data without sending the entire Excel spreadsheet. To do this, all you need to do is to use the "copy as picture" option. The Microsoft Office for Mac team shows you just how to insert a spreadsheet snippet in this how-to video.

Once you encounter the second boss in Dark Souls, you'll have to fight him on the bridge. The Taurus Demon boss is fairly difficult, so be sure to utilize the bridge to its full extent. The ladder that brings you to the top of the tower is your best answer. This IGN guide will show you how to beat him.

If you're headed through the firey hell region of Dark Souls, you may encounter the Ceaseless Discharge boss when you pick up the item in the corner. If you want to defeat the boss, take a look at this guide from IGN on utilizing a safe spot.

The Recon character class in Battlefield Bad Company 2: Vietnam is a thinly veiled sniper, and utilizing their target-spotting functionality is key to effective sniping in this game. This video is a complete guide to effective Recon play, teaching you about all your abilities, guns, and how you can spot targets to make yourself much more effective from much further away.

If you've ever taken high school chemistry, you may already be familiar with the ability of liquid nitrogen to freeze soft object so hard that they will shatter. This video will teach you a fun experiment utilizing this property of liquid nitrogen. It invovles gummi bears frozen and soaked in water or liquid nitrogen (or not, for the control) and then smashed in a most satisfying way.

Player housing is the best way of not only storing all of your extra gear, but also a place for rest and a place for your companions to go to when you don't need them! In this video you'll get a walkthrough of each of the available player housings in Fallout New Vegas!

In this clip, learn how to utilize the Curves tool to fix luminance problems. Whether you're new to Adobe's popular raster graphics editor or a seasoned designer looking to better acquaint yourself with the new features and functions of the latest iteration of the application, you're sure to benefit from this free software tutorial. For more information, watch this video guide.

Google is one of the most powerful forces on the Internet, and their technology can be the key to helping you find success in whatever your online endeavor might be, from web design to filmmaking. This video is a part of their Google Webmaster Series, offering help to webmasters the world over on how to best utilize Google in their work. This video will show you how to ensure that your Wordpress blog is safe from the hacker attacks that are so common for Wordpress users.

Learn how to utilize the trackpad on a BlackBerry Bold 9650 phone. This clip will show you how it's done. Whether you're the proud owner of a BlackBerry smartphone or are merely considering picking one up, you're sure to be well served by this video guide. For detailed information, including step-by-step instructions, and to get started using the BlackBerry Bold 9650 trackpad yourself, take a look.

Google is one of the most powerful forces on the Internet, and their technology can be the key to helping you find success in whatever your online endeavor might be, from web design to filmmaking. This video is a part of their Google Webmaster Series, offering help to webmasters the world over on how to best utilize Google in their work. This video will show you how to optimize your deep web content, like databases and forms, to be crawled by Google using a few simple tricks.

Twitter is a very powerful way to create word-of-mouth buzz for your website if you can utilize it properly. One way to do that is creating a Tweet This link on your website, which allows your users to tweet about how awesome your website is without going back to Twitter. This video will show you how to create a Tweet This link and put it on your website using Dreamweaver CS4.

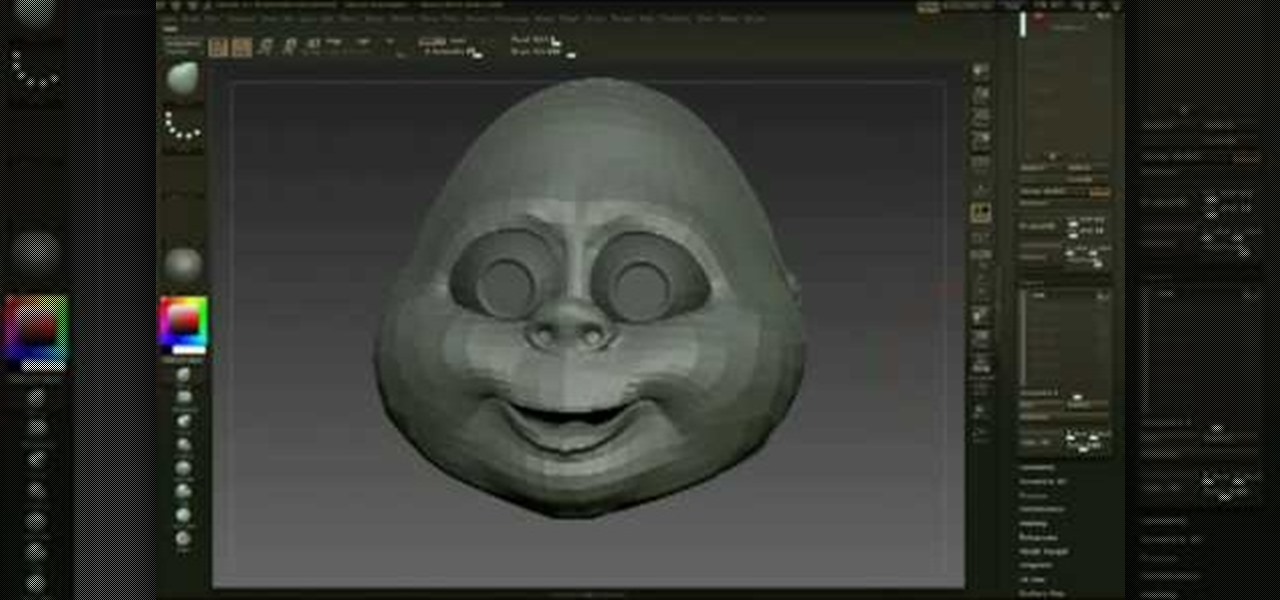
THis video from accredited 3D art instructor Andrew Klein covers how to create symmetrical and asymmetrical blendshapes using the 3D sculpting program Zbrush. This is a fairly complex process, utilizing transpose masking features, move brush, smart resym, and morph target tools to accomplish its goal of creating a really cool animated 3D mask.

Embrace the current retro revival in fashion and design by creating this cool midcentury-chic poster. You can create this psychedelic wavy pattern for a band poster, a movie, or just as a piece of art to hang up on your wall.

This video will discuss how to implement color changes in Photoshop editing. This step by step approach will tutor the novice Photoshop user how to utilize the various tools and applications to achieve, colorization in photos, swap select and hue, colors and backgrounds of photos, describes layering using saturation and blend techniques. This video tutorial will describe and demonstrate the correct settings and tool usage for easy application of each editing and color manipulation.

Watch this professional cinematography video to learn how to make linear tracks on the P+S Technik SKATER Mini dolly to better utilize and maximize its performance. It's actually extremely fast to get the Skater ready to shoot. Learn how to make straight tracks inward as well as a typical linear tracking shot. View final footage of the Skater used on professional film sets.

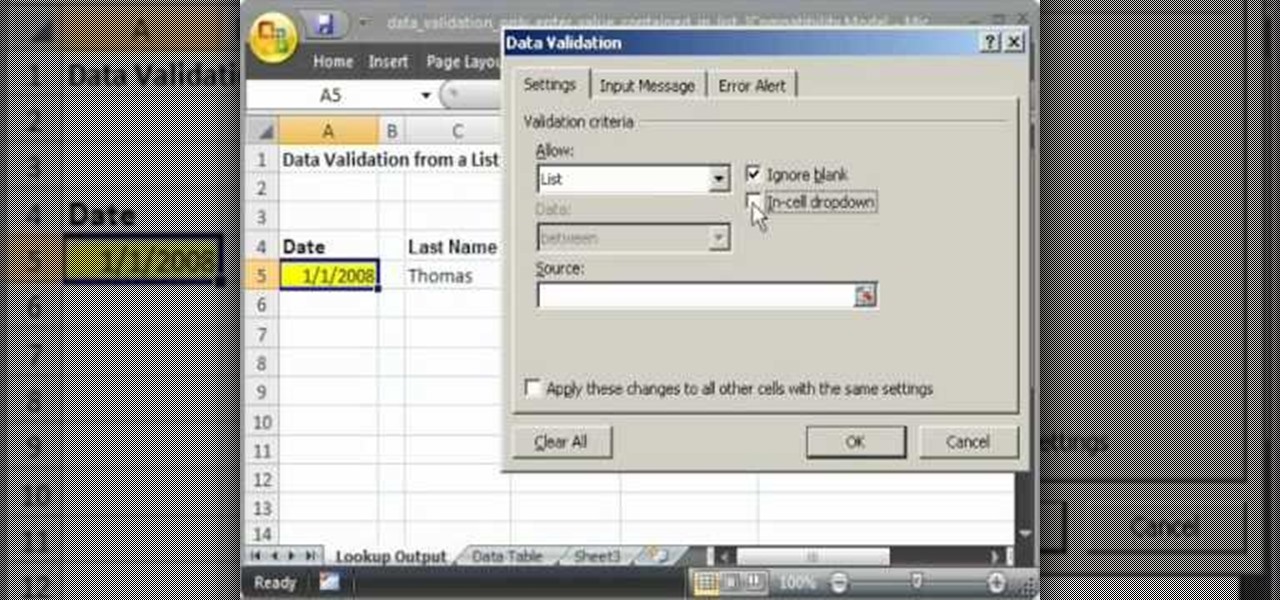
This video shows you how to idiot-proof a data set in Excel pretty much. It demonstrates how to enable data validation in a cell, so that when you type something in it must be in a predetermined list or will not work. Start by typing in your data table in a second tab. His example is a date, then information about certain employees based on that day. To enter the data validation menu, click the cell you want to use and then hit ALT+D+L to bring it up. Go to settings, then under the Allow menu...

Looking to find the standard deviation of your set of values? Standard deviation quantifies how diverse the values of your data set are, and is useful in determining how different your numbers are from each other.

In Halo: Reach for the Xbox 360, there is so much to do! The campaign, the multiplayer, the achievements! But One tough one to get is all 19 hidden data pads. Luckily for you, the first nine can be acquired on any difficulty, and in this video you will learn the locations of all nine of the initial data pads on levels such as Winter Contingency and Pillar of Autumn!

We all have our reasons for erasing personal data from a phone. Whether you just ended a bad relationship whose face you never want to see again (lots of text messages) or just want to restore your privacy on the cell phone, erasing may be your only option.

If you use Microsoft Excel on a regular basis, odds are you work with numbers. Put those numbers to work. Statistical analysis allows you to find patterns, trends and probabilities within your data. In this MS Excel tutorial from everyone's favorite Excel guru, YouTube's ExcelsFun, the 27th installment in his "Excel Statistics" series of free video lessons, you'll learn how to create a quantitative data dot plot chart using the REPT and COUNTIF functions.

If you use Microsoft Excel on a regular basis, odds are you work with numbers. Put those numbers to work. Statistical analysis allows you to find patterns, trends and probabilities within your data. In this MS Excel tutorial from everyone's favorite Excel guru, YouTube's ExcelsFun, the 16th installment in his "Excel Statistics" series of free video lessons, you'll learn how to cross tabulate & do percentage cross tabulation for categorical data using a pivot table (PivotTable).

If you use Microsoft Excel on a regular basis, odds are you work with numbers. Put those numbers to work. Statistical analysis allows you to find patterns, trends and probabilities within your data. In this MS Excel tutorial from everyone's favorite Excel guru, YouTube's ExcelsFun, the 17th installment in his "Excel Statistics" series of free video lessons, you'll learn how to cross tabulate & do percentage cross tabulation for categorical data using formulas rather than pivot tables.

If you use Microsoft Excel on a regular basis, odds are you work with numbers. Put those numbers to work. Statistical analysis allows you to find patterns, trends and probabilities within your data. In this MS Excel tutorial from everyone's favorite Excel guru, YouTube's ExcelsFun, the 10th installment in his "Excel Statistics" series of free video lessons, you'll learn how about data sets and the nominal, ordinal, interval and ration scales/levels of measurement and see two Pivot Tables that...

There is so much information in the world that trying to make sense of it all can be daunting. That's where data analytics comes in. By learning how to inspect and model data, you can take large data sets and transform them into highly valuable information that can take any business further.

The key to becoming a competent white hat is knowing how the technology that you are trying to exploit actually works. SQL injection is one of the most common methods of attack used today and also one of the easiest to learn. In order to understand how this attack works, you need to have a solid grasp of ... you've guessed it ... SQL.

When Apple revamped the storage management system in iOS 11, it built in a feature that lets you free up space on your iPhone in a more efficient manner. The option allows you to remove an app while preserving its data and documents should you choose to reinstall it later — and it can even do so automatically for unused apps when you're running out of space.

Excel is great, and if you're a Mac user, Excel 2008 for Mac has a lot of new and useful great features you can use to maximize efficiency in your spreadsheets. Excel doesn't have to be the boss anymore, you can! The Microsoft Office for Mac team shows you all the great features in this how-to video.

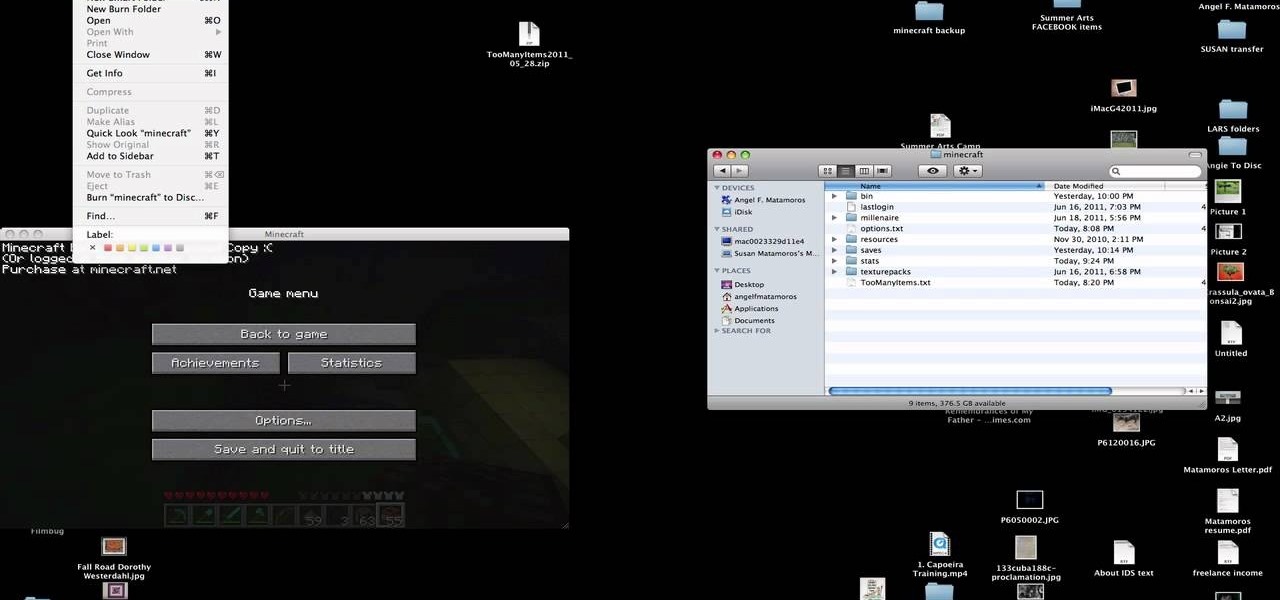
You have worked long and hard creating an entire world of Minecraft data. Make sure you have all of that saved data backed up. Watch this video to learn how to backup your Minecraft data. You will be glad that you did.

Smartphones are becoming pocket computers, jammed full of data essential to our personal and professional lives. With AT&T's 360 Backup app you can protect your important information with the push of a few buttons.

Thirty dollars a month may be a little steep for an unlimited data plan for iPad users. To cut down on your data usage, you can download the Offline Pages app to browse articles or blogs offline. InstaPaper is another account you can use as well, and both will cut down on your data usage per month.

New to Microsoft Excel? Looking for a tip? How about a tip so mind-blowingly useful as to qualify as a magic trick? You're in luck. In this MS Excel tutorial from ExcelIsFun, the 6th installment in their series of digital spreadsheet magic tricks, you'll learn how to add conditional formatting to a whole row of data in an Excel sheet.

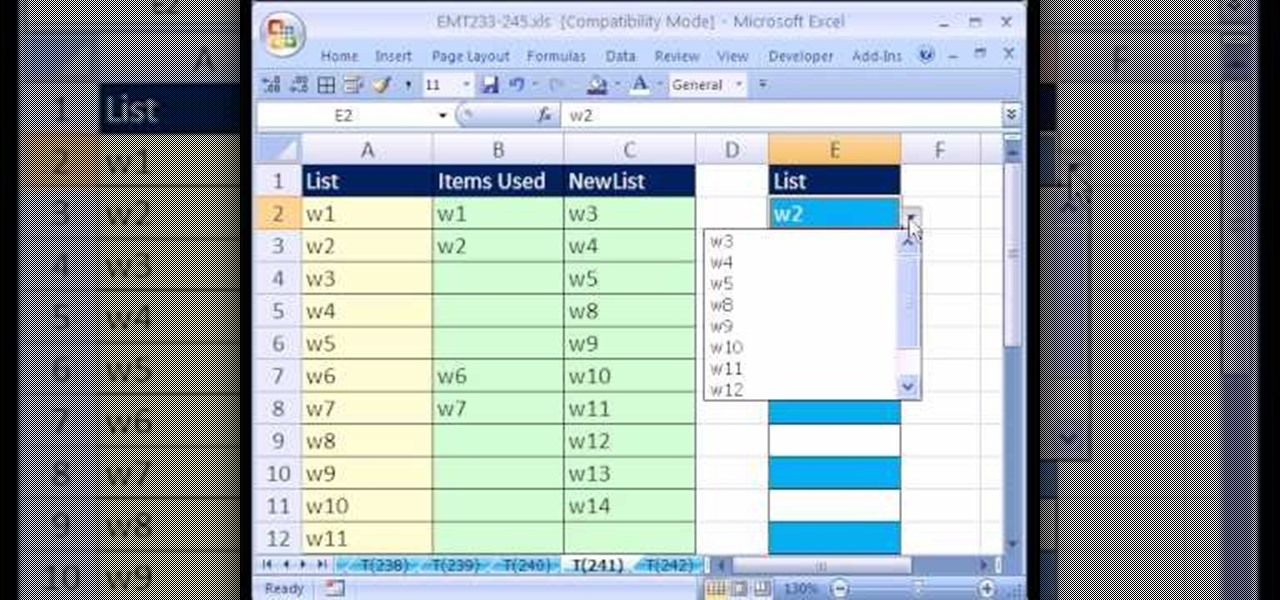
New to Microsoft Excel? Looking for a tip? How about a tip so mind-blowingly useful as to qualify as a magic trick? You're in luck. In this MS Excel tutorial from ExcelIsFun, the 241st installment in their series of digital spreadsheet magic tricks, you'll learn how to create a data validation drop-down cell list where the list shrinks as you select values.

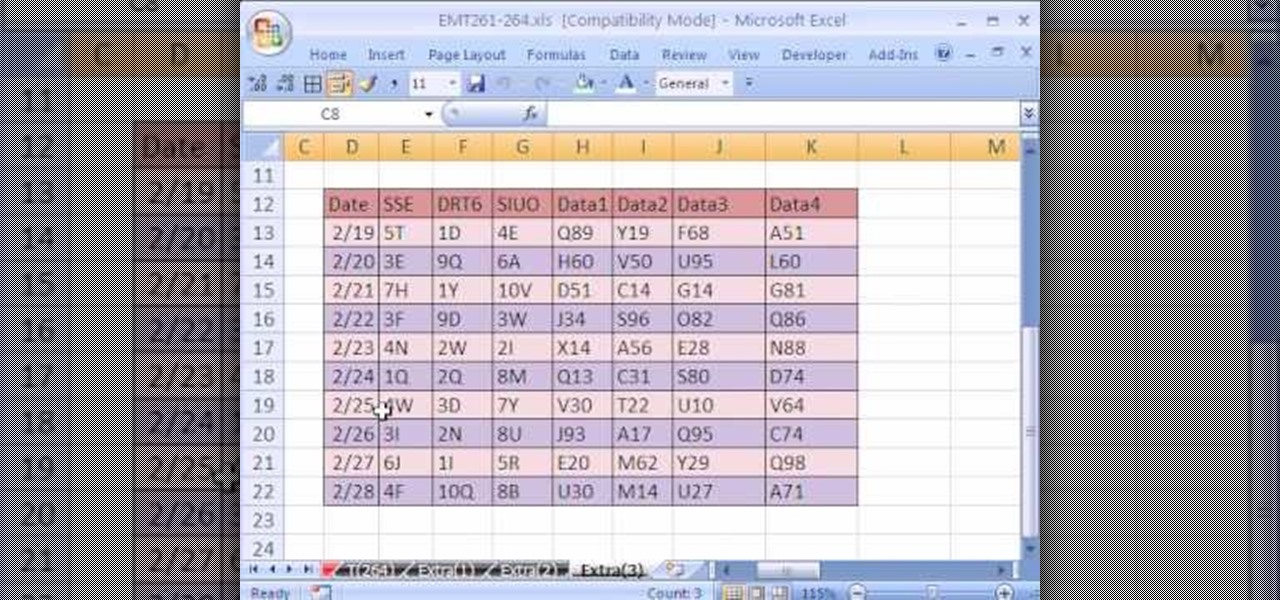
New to Excel? Looking for a tip? How about a tip so mind-blowingly useful as to qualify as a magic trick? You're in luck. In this Excel tutorial from ExcelIsFun, the 264th installment in their series of digital spreadsheet magic tricks, you'll learn how to use a recorded macro to take a data set and add a new column, concatenate data from 3 columns, and delete unwanted columns.

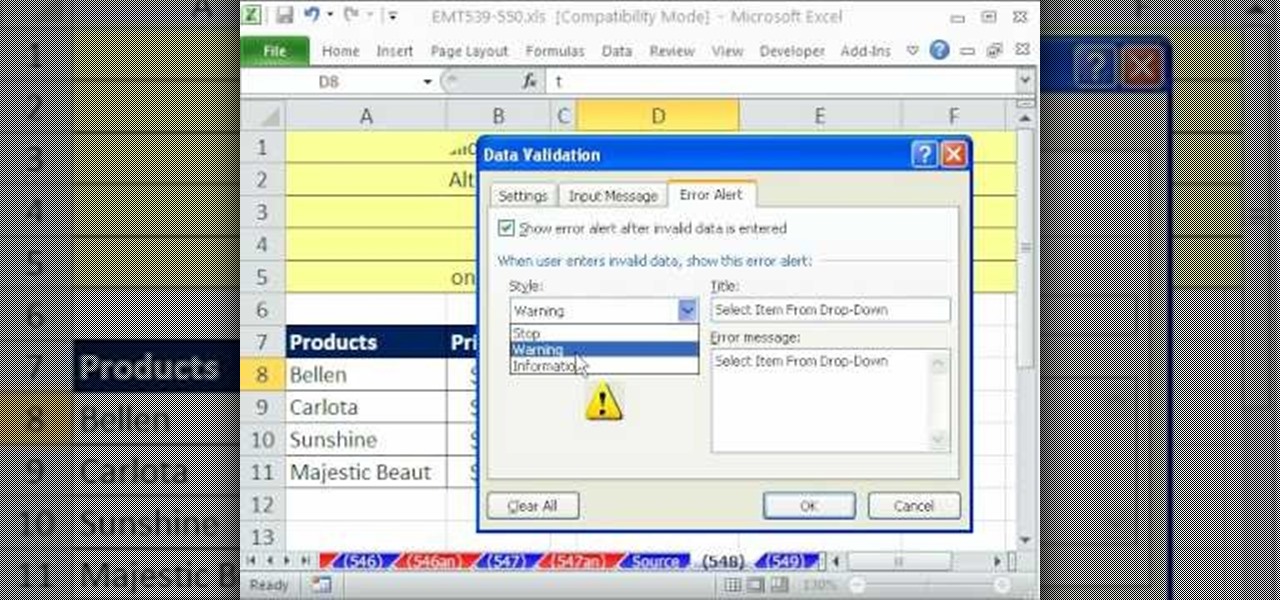
If you want to manage what sort of data is entered into your Excel spreadsheet, data validation will help you to accomplish just that. In this Excel tutorial from ExcelIsFun, the 549th installment in their series of Excel magic tricks, you'll learn how to use data validation to full effect in your Microsoft Office projects.

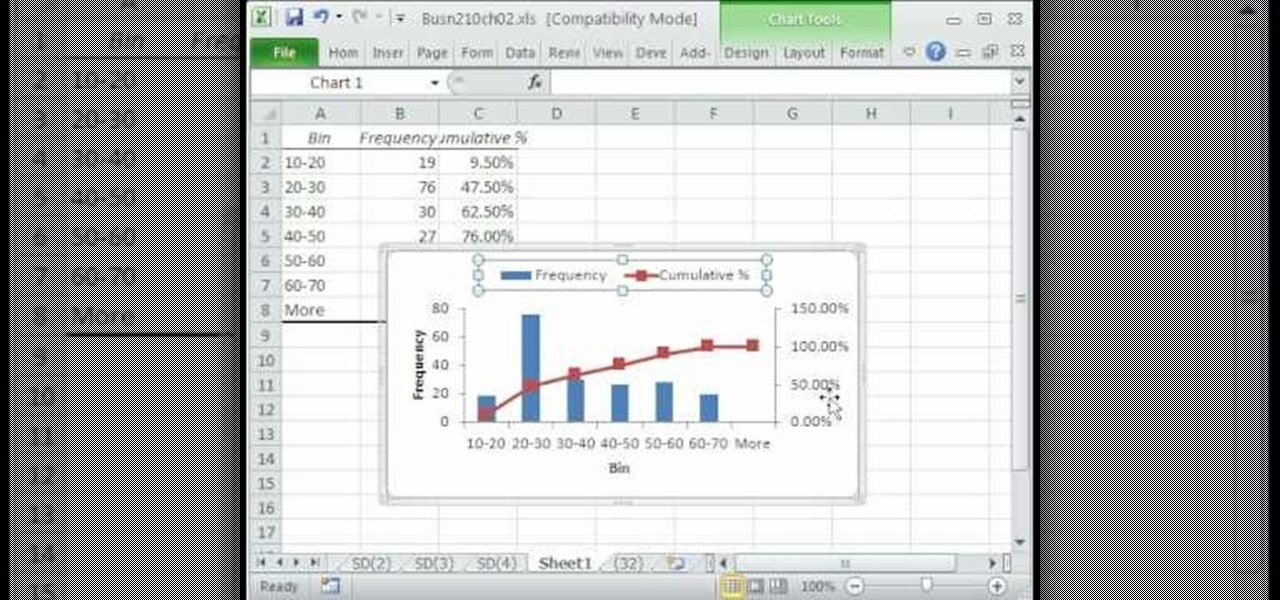
A histogram is a summary graph showing a count of data points that fall in various ranges. Histograms are used in statistics and other forms of mathematics. In this video, learn how to create your own histogram using data analysis on the computer. This tutorial will show you how to create a frequency distribution, a cumulative frequency distribution, a histogram chart and an ogive chart with the data analysis add-in.

See how simple it is to create data-driven web sites using ASP.NET 2.0, Visual Web Developer 2005 Express Edition, and SQL Server 2005 Express Edition. Watch this video tutorial to learn how to create a database, add its data, and display that data on a web page.


