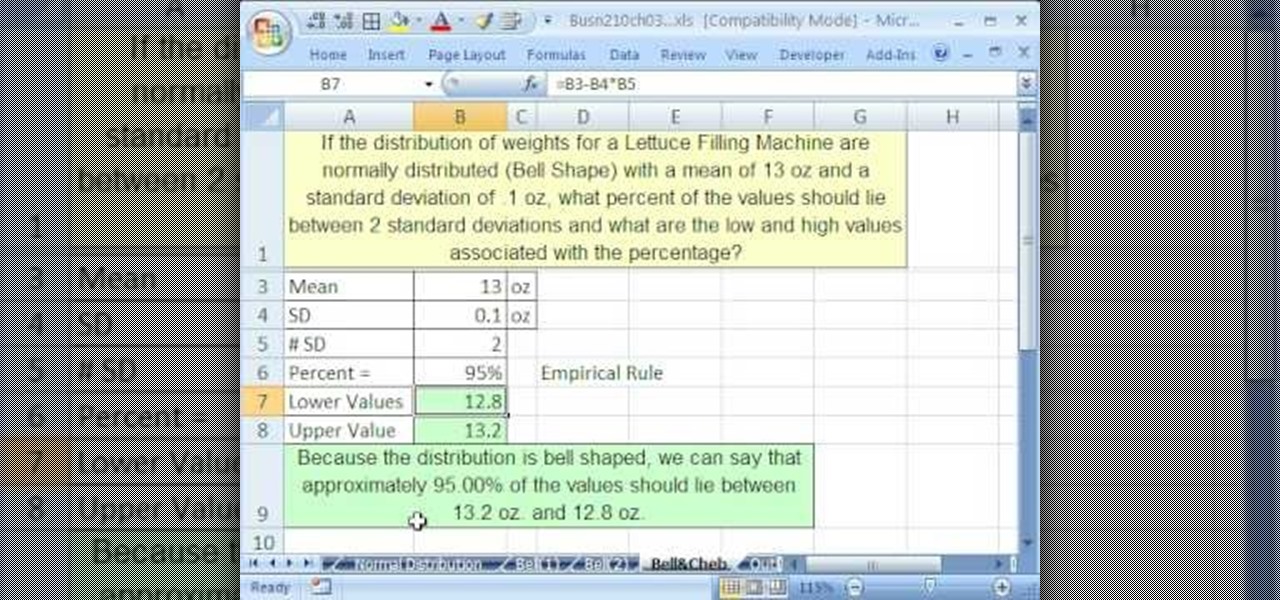
If you use Microsoft Excel on a regular basis, odds are you work with numbers. Put those numbers to work. Statistical analysis allows you to find patterns, trends and probabilities within your data. In this MS Excel tutorial from everyone's favorite Excel guru, YouTube's ExcelsFun, the 47th installment in his "Excel Statistics" series of free video lessons, you'll learn about the basics of the empirical rule (the bell curve) and how to apply it in various ways.

If you use Microsoft Excel on a regular basis, odds are you work with numbers. Put those numbers to work. Statistical analysis allows you to find patterns, trends and probabilities within your data. In this MS Excel tutorial from everyone's favorite Excel guru, YouTube's ExcelsFun, the 89th installment in his "Excel Statistics" series of free video lessons, you'll learn how to use the NORMSINV function for critical values and the NORSDIST function for p-values.

If you use Microsoft Excel on a regular basis, odds are you work with numbers. Put those numbers to work. Statistical analysis allows you to find patterns, trends and probabilities within your data. In this MS Excel tutorial from everyone's favorite Excel guru, YouTube's ExcelsFun, the 91st installment in his "Excel Statistics" series of free video lessons, you'll learn how to use TINV and TDIST functions to find critical values given an unknown sigma value.

If you use Microsoft Excel on a regular basis, odds are you work with numbers. Put those numbers to work. Statistical analysis allows you to find patterns, trends and probabilities within your data. In this MS Excel tutorial from everyone's favorite Excel guru, YouTube's ExcelsFun, the 80th installment in his "Excel Statistics" series of free video lessons, you'll learn how to construct confidence intervals when the sigma is known known using the CONFIDENCE and NORMSINV functions.

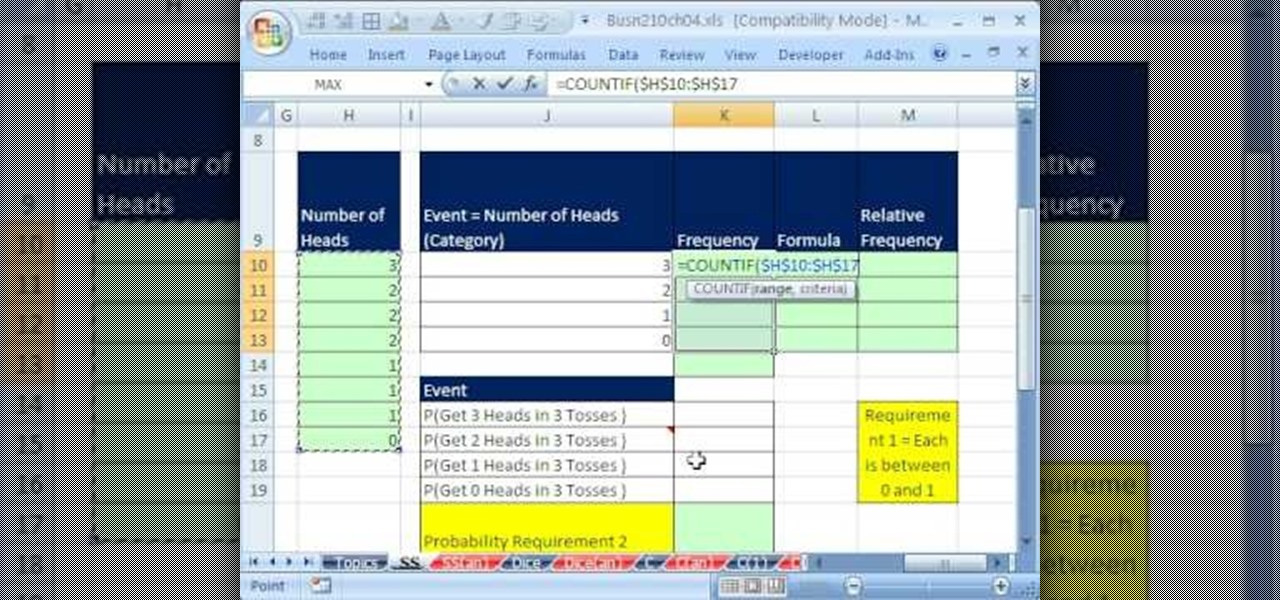
If you use Microsoft Excel on a regular basis, odds are you work with numbers. Put those numbers to work. Statistical analysis allows you to find patterns, trends and probabilities within your data. In this MS Excel tutorial from everyone's favorite Excel guru, YouTube's ExcelsFun, the 21st installment in his "Excel Statistics" series of free video lessons, you'll learn how to build labels and counting formulas for a frequency distribution.

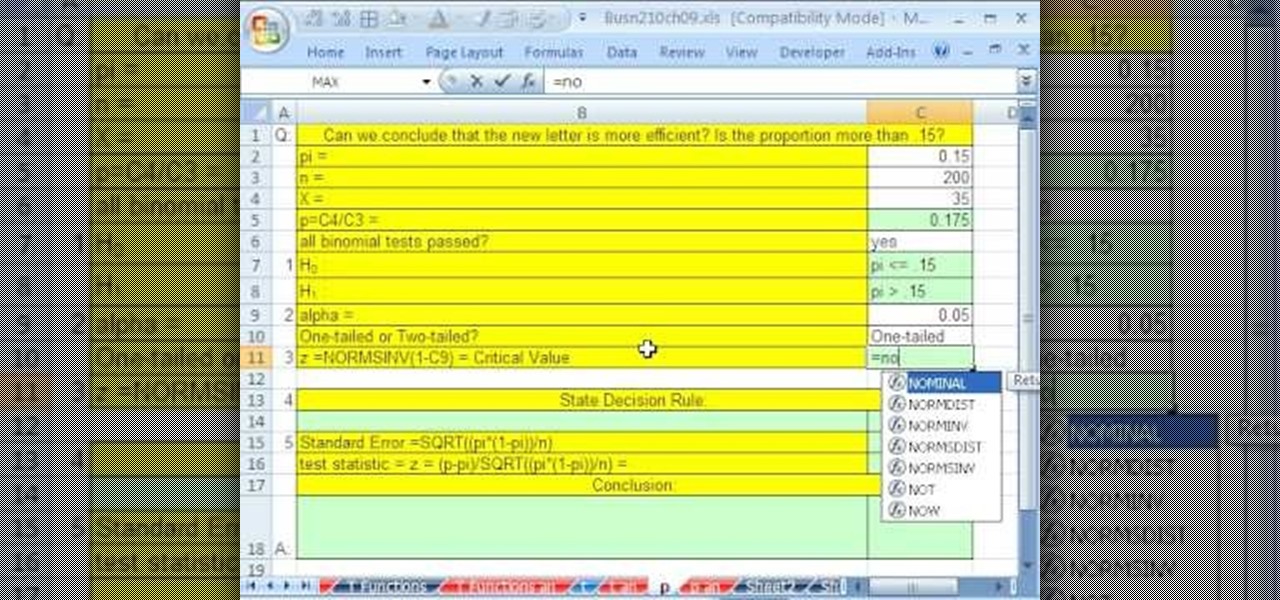
If you use Microsoft Excel on a regular basis, odds are you work with numbers. Put those numbers to work. Statistical analysis allows you to find patterns, trends and probabilities within your data. In this MS Excel tutorial from everyone's favorite Excel guru, YouTube's ExcelsFun, the 87th installment in his "Excel Statistics" series of free video lessons, you'll learn how to use NORMSINV to test a hypothesis with population standard deviation (sigma) known and proportions.

If you use Microsoft Excel on a regular basis, odds are you work with numbers. Put those numbers to work. Statistical analysis allows you to find patterns, trends and probabilities within your data. In this MS Excel tutorial from everyone's favorite Excel guru, YouTube's ExcelsFun, the 28th installment in his "Excel Statistics" series of free video lessons, you'll learn how to create quantitative data stem & leaf charts using the REPT and COUNTIF functions.
If you use Microsoft Excel on a regular basis, odds are you work with numbers. Put those numbers to work. Statistical analysis allows you to find patterns, trends and probabilities within your data. In this MS Excel tutorial from everyone's favorite Excel guru, YouTube's ExcelsFun, the 13th installment in his "Excel Statistics" series of free video lessons, you'll learn how to create a column chart from a frequency distribution for categorical data.
If you use Microsoft Excel on a regular basis, odds are you work with numbers. Put those numbers to work. Statistical analysis allows you to find patterns, trends and probabilities within your data. In this MS Excel tutorial from everyone's favorite Excel guru, YouTube's ExcelsFun, the 5th installment in his "Excel Statistics" series of free video lessons, you'll learn how to use relative and absolute cell references to save time when writing formulas.
A good first project for anyone interested in doing woodworking projects on a regular or semi-regular basis is, naturally, a wooden workbench. This carpenter's guide will help you to build a solid work table without breaking the bank in the process. For more information, including a step-by-step breakdown of the assembly process, watch this free video tutorial.
The area of a rectangle is the basis for all geometry. You will need to know how to do this in order to better understand other objects. This video tutorial will show you the formula for area of a rectangle and how to use it. Don't be confused in math class anymore.
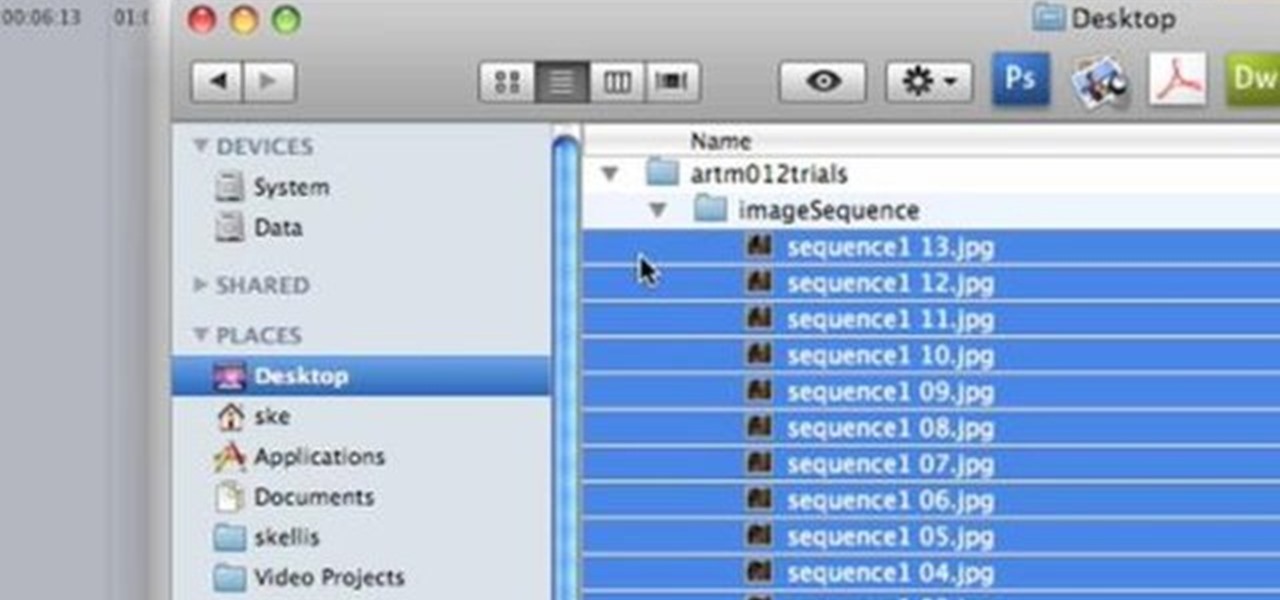
This video editing software tutorial shows you how to export an image sequence from Final Cut Pro. This isn't usually the format people export in, but if you are planning on using the frames for animating or further editing, you may want to export your work on a per frame basis. If this is the case, watch and learn how to export an image sequence from Final Cut Pro.
Learn how to turn classic lilies (or irises) into a kusudama. Use a cuboctahedron frame as a basis (12 lilies) and turn them into double lilies (another 12 are required).
After months of waiting, the iPhone 11 is here. At an event in Cupertino, Apple unveiled the iPhone 11, 11 Pro and 11 Pro max. You probably have a lot of questions after reviewing the specs sheet, including wanting to know more about the IP68 rating that all three phones have. We're here to clarify.
The day has finally arrived — Samsung has unveiled the Galaxy S9 and S9+. Apart from minor upgrades, the two might not appear to be much different from last year's S8 and S8+, but that's not necessarily a bad thing. One feature that hasn't changed is the Galaxy's IP68 water-resistance rating. That's a great score, but it begs the question — what does that number really mean?
It's the holidays. That means new smartphones, and new smartphones mean new cases. Whether it's the Galaxy S8, the iPhone X, or the Note 8, your new phone deserves to be protected. Of course, good cases can get pricey fast. That's what Black Friday is for, of course.
In case you didn't catch the big event in Cupertino, Apple just unveiled two of the most cutting-edge phones ever made — the iPhone 8 and the iPhone X. Out of the many glorious specs that were rattled off on stage, one stands out for being just a little confusing: Both models are rated IP67 under the IEC standard 60529.
When it comes to busted smartphones, liquid damage ranks right up there with shattered screens as one of the most common issues owners have to deal with—as well as the most embarrassing. Thankfully, though, with the rise of waterproof phones such as the Samsung Galaxy S7 and even the iPhone 7, this is becoming less and less of a worry. But not everyone has a waterproof device.
Yes! soon I will be able to log in more as I untie the shackles this map has placed on me in the time leading up to its eventual release and log in once in a while!
The robes of the Jedi and Sith are great bases for all sorts of Star Wars costumes. If you have some DIY flair and want to make your own Star Wars costume for Halloween or cosplay watch this video to learn how to make your own Jedi or Sith robes, depending on your character.
Looking for a guide on how to resize fonts on a per-website basis? It's easy. So easy, in fact, that this video tutorial can present a complete, step-by-step overview of the process in just over six minutes. For more information, including detailed, step-by-step instructions, take a look.
Firecrackers are one of the greatest noisemaking implements ever conceived, and have formed the basis of great pranks for generations. This video will show you how to pull arguably the most classic firecracker prank of all, the firecracker wakeup call. All you do is put firecrackers in a pot (for safety) near a sleeping person and light 'em off. Hilarious, but dangerous. Be careful, for Pete's sake.
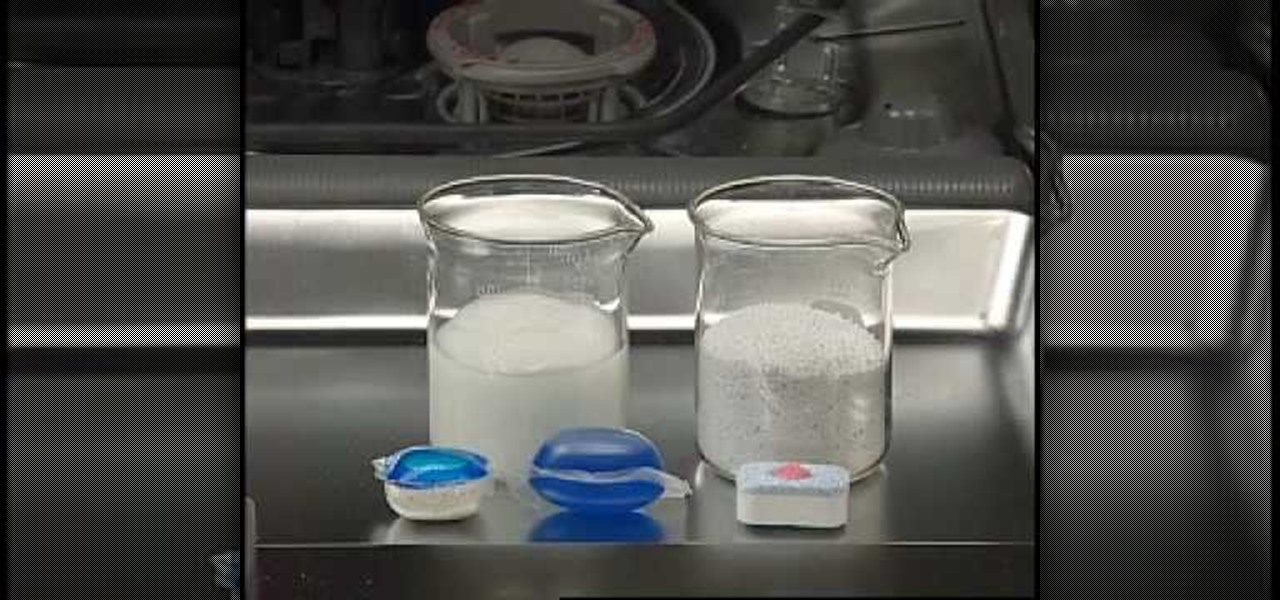
If you have hard water in your area, it can be rough on your dishwasher and sometimes your dishes. If you don't clean your machine on a regular basis, it loses the effectiveness of the machine.
For the budding magician, the card force is one of the most important techniques, forming the basis for many, many wonderful card tricks. In this tutorial youtube staple The Card Trick Master teaches us to perform an easy behind-the-back card force magic trick that is sure to wow your audiences.
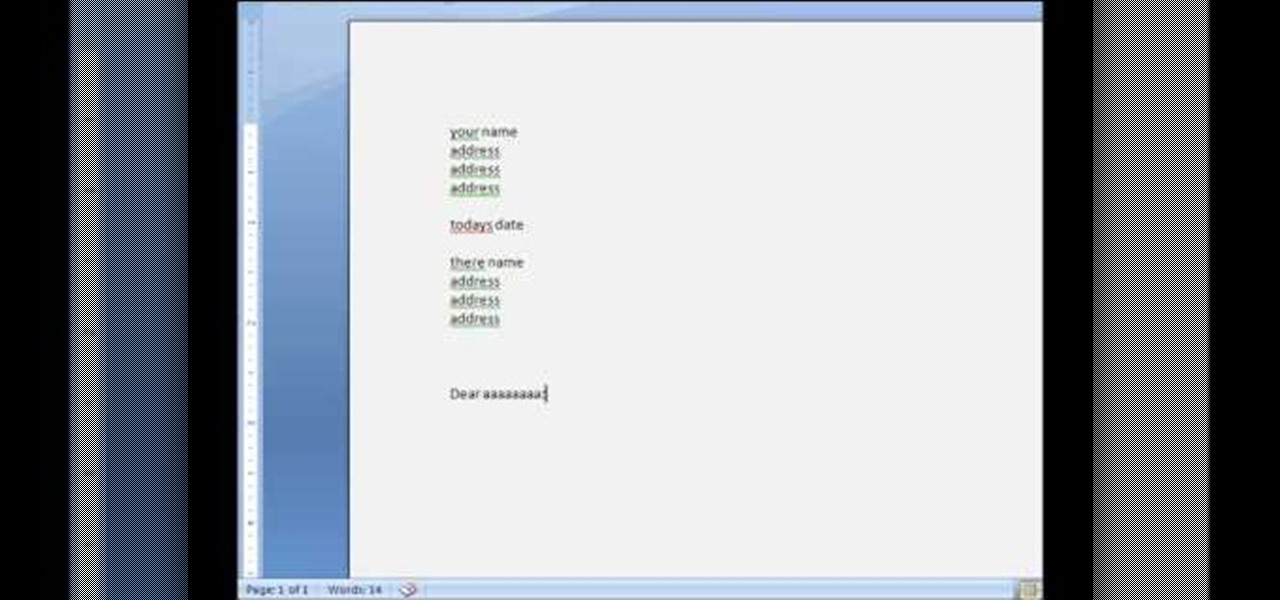
Type professional letters quickly and easily in Microsoft Word 2007
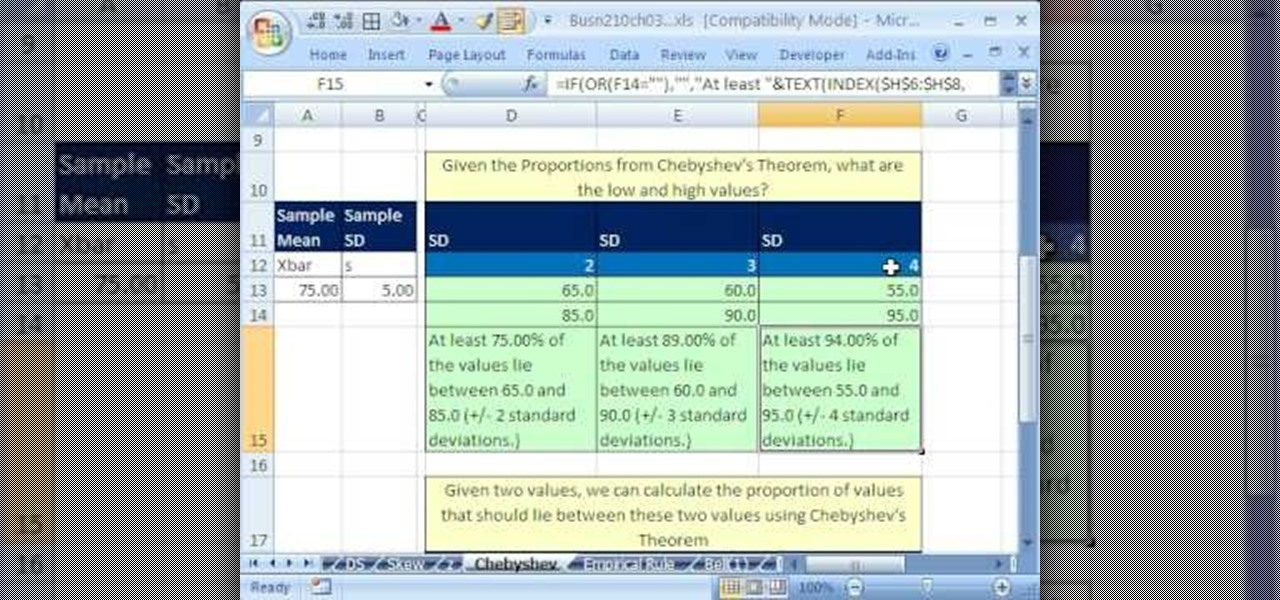
If you use Microsoft Excel on a regular basis, odds are you work with numbers. Put those numbers to work. Statistical analysis allows you to find patterns, trends and probabilities within your data. In this MS Excel tutorial from everyone's favorite Excel guru, YouTube's ExcelsFun, the 48th installment in his "Excel Statistics" series of free video lessons, you'll see comparison of Chebyshev's Theorem and the Empirical Rule (bell curve) and learn when to apply which.
If you use Microsoft Excel on a regular basis, odds are you work with numbers. Put those numbers to work. Statistical analysis allows you to find patterns, trends and probabilities within your data. In this MS Excel tutorial from everyone's favorite Excel guru, YouTube's ExcelsFun, the 46th installment in his "Excel Statistics" series of free video lessons, you'll learn about Chebyshev's Theorem and how to apply it in three different ways.
If you use Microsoft Excel on a regular basis, odds are you work with numbers. Put those numbers to work. Statistical analysis allows you to find patterns, trends and probabilities within your data. In this MS Excel tutorial from everyone's favorite Excel guru, YouTube's ExcelsFun, the 43rd installment in his "Excel Statistics" series of free video lessons, you'll learn how to use the Excel Data Analysis add-in descriptive statistics tool.
If you use Microsoft Excel on a regular basis, odds are you work with numbers. Put those numbers to work. Statistical analysis allows you to find patterns, trends and probabilities within your data. In this MS Excel tutorial from everyone's favorite Excel guru, YouTube's ExcelsFun, the 42nd installment in his "Excel Statistics" series of free video lessons, you'll learn how to calculate the coefficient of variation.
If you use Microsoft Excel on a regular basis, odds are you work with numbers. Put those numbers to work. Statistical analysis allows you to find patterns, trends and probabilities within your data. In this MS Excel tutorial from everyone's favorite Excel guru, YouTube's ExcelsFun, the 30th installment in his "Excel Statistics" series of free video lessons, you'll learn how to create a scatter diagram for 2 quantitative variables.
If you use Microsoft Excel on a regular basis, odds are you work with numbers. Put those numbers to work. Statistical analysis allows you to find patterns, trends and probabilities within your data. In this MS Excel tutorial from everyone's favorite Excel guru, YouTube's ExcelsFun, the 51st installment in his "Excel Statistics" series of free video lessons, you'll learn how to understand, work with and find simple probabilities in Microsoft Office Excel.
If you use Microsoft Excel on a regular basis, odds are you work with numbers. Put those numbers to work. Statistical analysis allows you to find patterns, trends and probabilities within your data. In this MS Excel tutorial from everyone's favorite Excel guru, YouTube's ExcelsFun, the 93rd installment in his "Excel Statistics" series of free video lessons, you'll learn how to use the NORMSINV and NORMSDIST functions to complete a hypothesis test about a population proportion.
If you use Microsoft Excel on a regular basis, odds are you work with numbers. Put those numbers to work. Statistical analysis allows you to find patterns, trends and probabilities within your data. In this MS Excel tutorial from everyone's favorite Excel guru, YouTube's ExcelsFun, the 83rd installment in his "Excel Statistics" series of free video lessons, you'll learn how to construct confidence intervals when the sigma (population standard deviation) in NOT known using the TINV function.
If you use Microsoft Excel on a regular basis, odds are you work with numbers. Put those numbers to work. Statistical analysis allows you to find patterns, trends and probabilities within your data. In this MS Excel tutorial from everyone's favorite Excel guru, YouTube's ExcelsFun, the 29th installment in his "Excel Statistics" series of free video lessons, you'll learn how to create quantitative data cross tabulation using a pivot table (PivotTable).
If you use Microsoft Excel on a regular basis, odds are you work with numbers. Put those numbers to work. Statistical analysis allows you to find patterns, trends and probabilities within your data. In this MS Excel tutorial from everyone's favorite Excel guru, YouTube's ExcelsFun, the 11th installment in his "Excel Statistics" series of free video lessons, you'll learn how to work with, and create charts for, cross-sectional and time-series data.
If you use Microsoft Excel on a regular basis, odds are you work with numbers. Put those numbers to work. Statistical analysis allows you to find patterns, trends and probabilities within your data. In this MS Excel tutorial from everyone's favorite Excel guru, YouTube's ExcelsFun, the 13th installment in his "Excel Statistics" series of free video lessons, you'll learn how to install the Excel 2007 Data Analysis add-in.
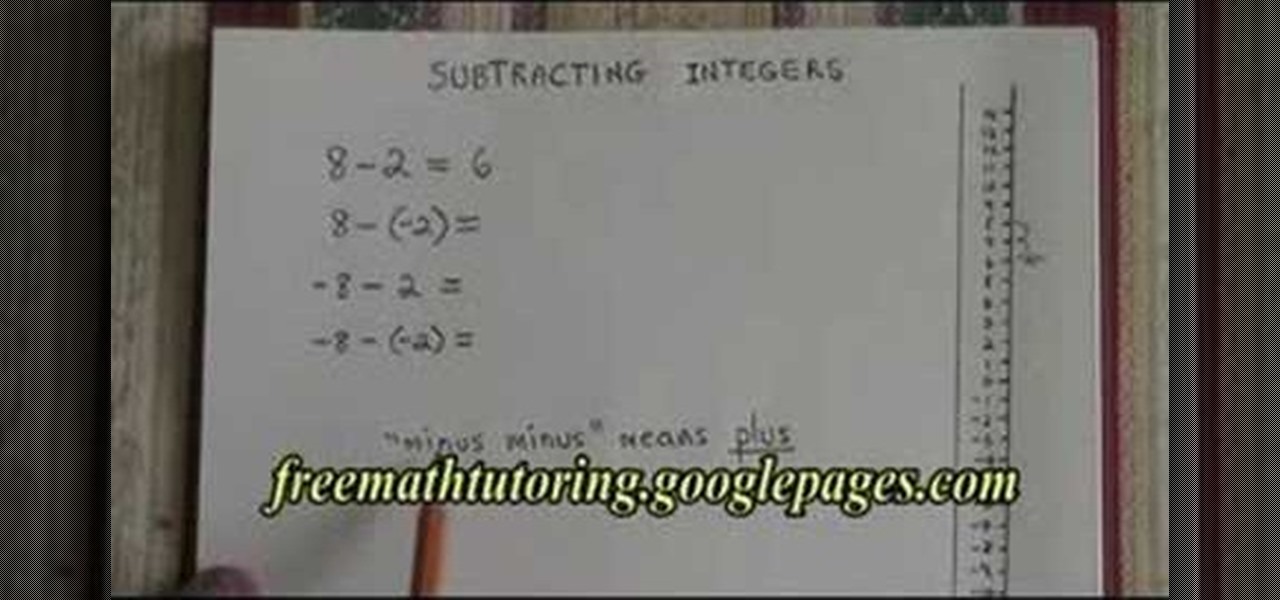
Working with integers is the basis of all mathematics. Subtracting is naturally a little more complicated than adding. If you are having trouble with subtraction, check out this video. This tutorial illustrates how to subtract integers, as used in high school math courses.
Learn how to tie a Tom Fool's knot - this knot is a basis for a number of decorative and functional knots. This knot can be used in sailing, boating, general use, camping and bondage.
The Hundred is a classic piece of pilates that’s not only great for your body, but is as easy as one, two, three…
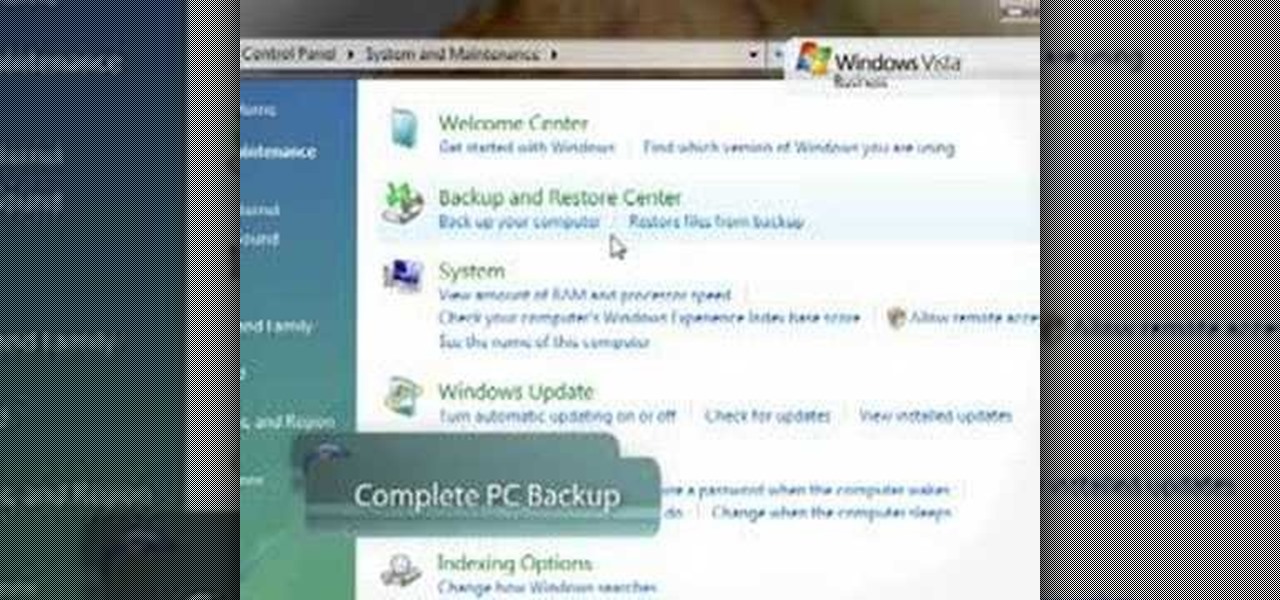
While many people back up their important files on a regular basis, few back up their entire computer. If your computer were to crash or be damaged, reinstalling the software for your system can mean hours or days of downtime. In this video tutorial, you'll learn how to use the PC Backup and Restore features in Microsoft Windows Vista. Take a look.