If you use Microsoft Excel on a regular basis, odds are you work with numbers. Put those numbers to work. Statistical analysis allows you to find patterns, trends and probabilities within your data. In this MS Excel tutorial from everyone's favorite Excel guru, YouTube's ExcelsFun, the 13th installment in his "Excel Statistics" series of free video lessons, you'll learn how to install the Excel 2007 Data Analysis add-in.

A histogram is a summary graph showing a count of data points that fall in various ranges. Histograms are used in statistics and other forms of mathematics. In this video, learn how to create your own histogram using data analysis on the computer. This tutorial will show you how to create a frequency distribution, a cumulative frequency distribution, a histogram chart and an ogive chart with the data analysis add-in.

There is a substantial number of helpful tools at your disposal in Microsoft Word when it comes to writing; grammar check, word count, dictionary, thesaurus, and tons more. One tool that doesn't necessarily make itself obvious is testing your document's readability. With this built-in tool, you can not only check your spelling and grammar, but also the reading level of your document.

Companies are already clamoring to figure out strategies for integrating augmented reality into their advertising platforms. AR is going to become a huge asset to marketers, and Apple's ARKit is only going to help that along. Mixed reality producer Bilawal Singh Sidhu has given us a sneak peek of what the world of advertising could be with the ARKit.

Interested to know how many times you've clicked your mouse of the course of the past month? How many keys you've typed? This clip will show you how it's done. With WinOMeter, it's easy! So easy, in fact, that this handy home-computing how-to from the folks at Tekzilla can present a complete overview of the process in about two minutes' time. For more information, including detailed, step-by-step instructions, take a look.

If you use Microsoft Excel on a regular basis, odds are you work with numbers. Put those numbers to work. Statistical analysis allows you to find patterns, trends and probabilities within your data. In this MS Excel tutorial from everyone's favorite Excel guru, YouTube's ExcelsFun, the 92nd installment in his "Excel Statistics" series of free video lessons, you'll learn how to use the TINV and TDIST functions to test a hypothesis.

If you use Microsoft Excel on a regular basis, odds are you work with numbers. Put those numbers to work. Statistical analysis allows you to find patterns, trends and probabilities within your data. In this MS Excel tutorial from everyone's favorite Excel guru, YouTube's ExcelsFun, the 85th installment in his "Excel Statistics" series of free video lessons, you'll learn how to construct confidence intervals for proportions using NORMSINV function and other formulas.
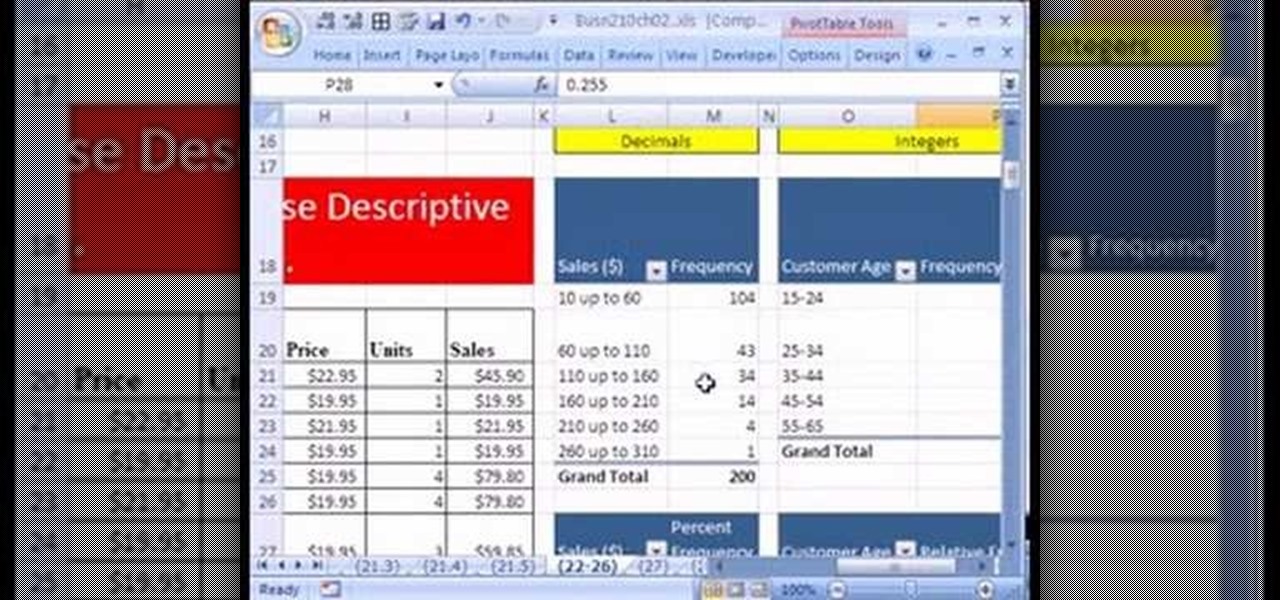
If you use Microsoft Excel on a regular basis, odds are you work with numbers. Put those numbers to work. Statistical analysis allows you to find patterns, trends and probabilities within your data. In this MS Excel tutorial from everyone's favorite Excel guru, YouTube's ExcelsFun, the 24th installment in his "Excel Statistics" series of free video lessons, you'll learn how to create quantitative data frequency distributions with pivot tables. See how to create the correct unambiguous labels ...
If you use Microsoft Excel on a regular basis, odds are you work with numbers. Put those numbers to work. Statistical analysis allows you to find patterns, trends and probabilities within your data. In this MS Excel tutorial from everyone's favorite Excel guru, YouTube's ExcelsFun, the 12th installment in his "Excel Statistics" series of free video lessons, you'll learn how to use Advanced Filter 'Unique Records Only" to extract a list of unique items from a data base, and then use the COUNTI...
Link shortening is the process of cleaning up the URL link which is long and converting it into a short URL. You can use bit.ly to do link shortening. Using bit.ly you can not only shorten the link but also track the users who are using those links. To use this service go to the http://www.bit.ly website. There in the home page you are provided with a text box. Enter your long link in the text box and submit it. Now the website converts the long URL and provides you with a short link which ca...
Need a little help with your math homework? No problem, the Math Centre offers students video tutorials that will provide as a reference guide for self-study. Students get self-study resources targeted to the needs of individual courses, and teachers gain generic mathematics support and study materials for use with students.
Need a little help with your math homework? No problem, the Math Centre offers students video tutorials that will provide as a reference guide for self-study. Students get self-study resources targeted to the needs of individual courses, and teachers gain generic mathematics support and study materials for use with students.
Need a little help with your math homework? No problem, the Math Centre offers students video tutorials that will provide as a reference guide for self-study. Students get self-study resources targeted to the needs of individual courses, and teachers gain generic mathematics support and study materials for use with students.
Need a little help with your math homework? No problem, the Math Centre offers students video tutorials that will provide as a reference guide for self-study. Students get self-study resources targeted to the needs of individual courses, and teachers gain generic mathematics support and study materials for use with students.
Need a little help with your math homework? No problem, the Math Centre offers students video tutorials that will provide as a reference guide for self-study. Students get self-study resources targeted to the needs of individual courses, and teachers gain generic mathematics support and study materials for use with students.
Need a little help with your math homework? No problem, the Math Centre offers students video tutorials that will provide as a reference guide for self-study. Students get self-study resources targeted to the needs of individual courses, and teachers gain generic mathematics support and study materials for use with students.
Need a little help with your math homework? No problem, the Math Centre offers students video tutorials that will provide as a reference guide for self-study. Students get self-study resources targeted to the needs of individual courses, and teachers gain generic mathematics support and study materials for use with students.
Need a little help with your math homework? No problem, the Math Centre offers students video tutorials that will provide as a reference guide for self-study. Students get self-study resources targeted to the needs of individual courses, and teachers gain generic mathematics support and study materials for use with students.
Need a little help with your math homework? No problem, the Math Centre offers students video tutorials that will provide as a reference guide for self-study. Students get self-study resources targeted to the needs of individual courses, and teachers gain generic mathematics support and study materials for use with students.
Need a little help with your math homework? No problem, the Math Centre offers students video tutorials that will provide as a reference guide for self-study. Students get self-study resources targeted to the needs of individual courses, and teachers gain generic mathematics support and study materials for use with students.
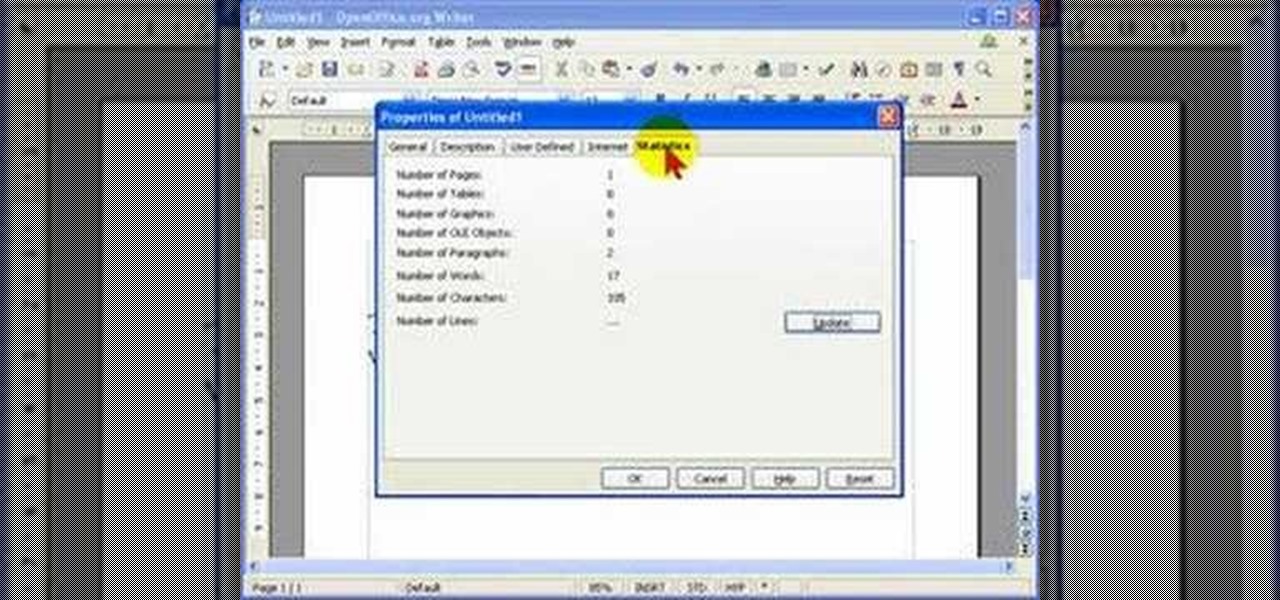
When creating word processed documents, there are often times when it is important that you know exactly how many words you have written - for example, student writing their dissertation, and journalists writing articles.
Most people keep their ungodly sexual desires deep inside, only to be indulged in private on their computers. It makes you wonder... what secrets do your neighbors have? What kind of porn are they watching? And how much and for how long? Thanks to some public (and anonymous) data, you can now find out.
Fantasize about role playing? One of the most popular venues for role playing medieval fantasy is the board game, Dungeons and Dragons. Get a group of three or four together and have a blast!
Want to change the world? See the Buddhist reflections on social, political and environmental action leading towards the creation of a better world, dedicated to Goerge W. Bush and Osama Bin Laden, from the Buddhist Society of Western Australia.
The SSC P7 Flashlight is a tactical torch that's pretty bright at 900LM. But, it's totally possible to make it just a little brighter.
Whether you're interested in learning Microsoft Excel from the bottom up or just looking to pick up a few tips and tricks, you've come to the right place. In this tutorial from everyone's favorite digital spreadsheet guru, ExcelIsFun, the nth installment in his "Highline Excel Class" series of free video Excel lessons, you'll learn how to do basic statistical analysis in Excel. Specifically, this video covers the following topics:
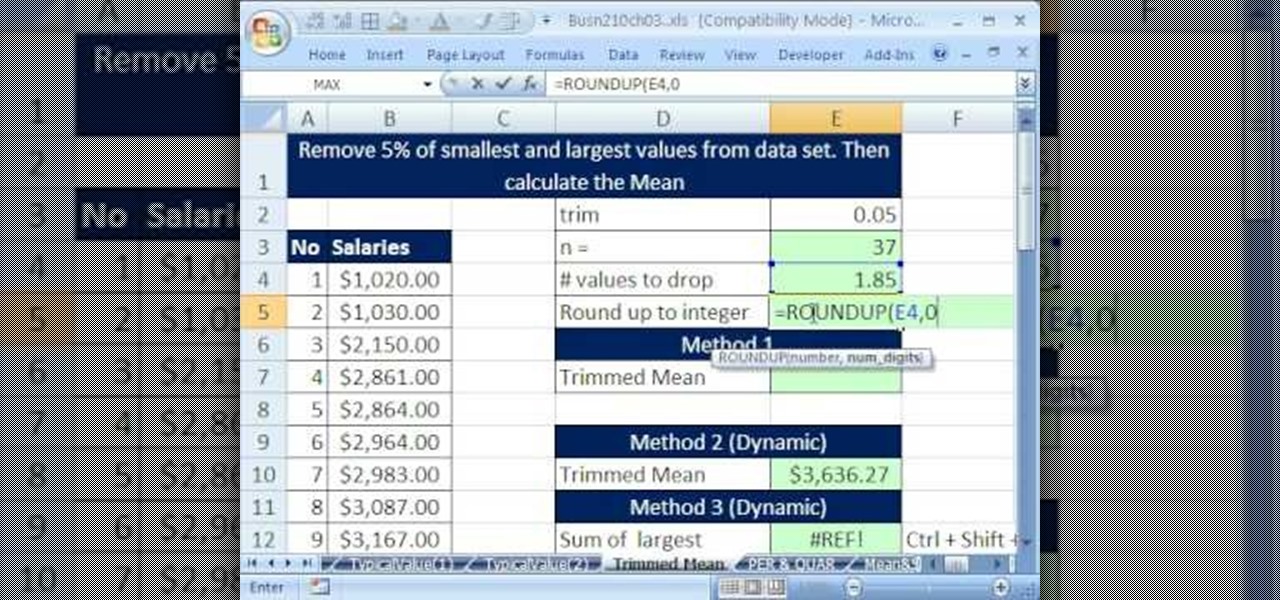
If you use Microsoft Excel on a regular basis, odds are you work with numbers. Put those numbers to work. Statistical analysis allows you to find patterns, trends and probabilities within your data. In this MS Excel tutorial from everyone's favorite Excel guru, YouTube's ExcelsFun, the 36th installment in his "Excel Statistics" series of free video lessons, you'll learn how to calculate a trimmed mean, which is used when there are extreme values in the data set that might skew the mean.
If you use Microsoft Excel on a regular basis, odds are you work with numbers. Put those numbers to work. Statistical analysis allows you to find patterns, trends and probabilities within your data. In this MS Excel tutorial from everyone's favorite Excel guru, YouTube's ExcelsFun, the 39th installment in his "Excel Statistics" series of free video lessons, you'll learn about variability (or dispersion or spread). Create an X-Y Scatter Diagram chart showing data points and the mean.
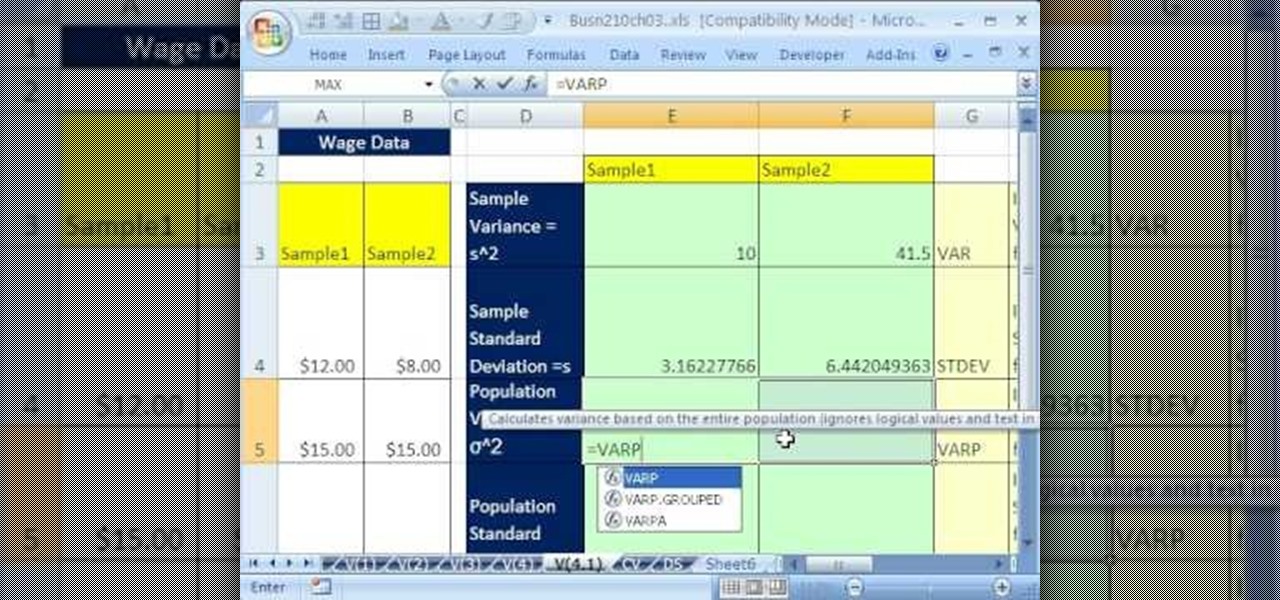
If you use Microsoft Excel on a regular basis, odds are you work with numbers. Put those numbers to work. Statistical analysis allows you to find patterns, trends and probabilities within your data. In this MS Excel tutorial from everyone's favorite Excel guru, YouTube's ExcelsFun, the 41st installment in his "Excel Statistics" series of free video lessons, you'll learn how to calculate deviations, variance and standard deviation for a sample and a population using Excel tables and the VAR, S...
If you use Microsoft Excel on a regular basis, odds are you work with numbers. Put those numbers to work. Statistical analysis allows you to find patterns, trends and probabilities within your data. In this MS Excel tutorial from everyone's favorite Excel guru, YouTube's ExcelsFun, the 32nd installment in his "Excel Statistics" series of free video lessons, you'll learn how to group when the quantitative data are whole numbers, integers or discrete data and how to group when the quantitative ...
If you use Microsoft Excel on a regular basis, odds are you work with numbers. Put those numbers to work. Statistical analysis allows you to find patterns, trends and probabilities within your data. In this MS Excel tutorial from everyone's favorite Excel guru, YouTube's ExcelsFun, the 25th installment in his "Excel Statistics" series of free video lessons, you'll learn how to create quantitative data percent & relative frequency distributions with pivot tables. Also see how to create a histo...
If you use Microsoft Excel on a regular basis, odds are you work with numbers. Put those numbers to work. Statistical analysis allows you to find patterns, trends and probabilities within your data. In this MS Excel tutorial from everyone's favorite Excel guru, YouTube's ExcelsFun, the 22nd installment in his "Excel Statistics" series of free video lessons, you'll learn how to create a percent (%) cumulative frequency distribution with formulas, a histogram and an ogive chart. See how to add ...
If you use Microsoft Excel on a regular basis, odds are you work with numbers. Put those numbers to work. Statistical analysis allows you to find patterns, trends and probabilities within your data. In this MS Excel tutorial from everyone's favorite Excel guru, YouTube's ExcelsFun, the 10th installment in his "Excel Statistics" series of free video lessons, you'll learn how about data sets and the nominal, ordinal, interval and ration scales/levels of measurement and see two Pivot Tables that...
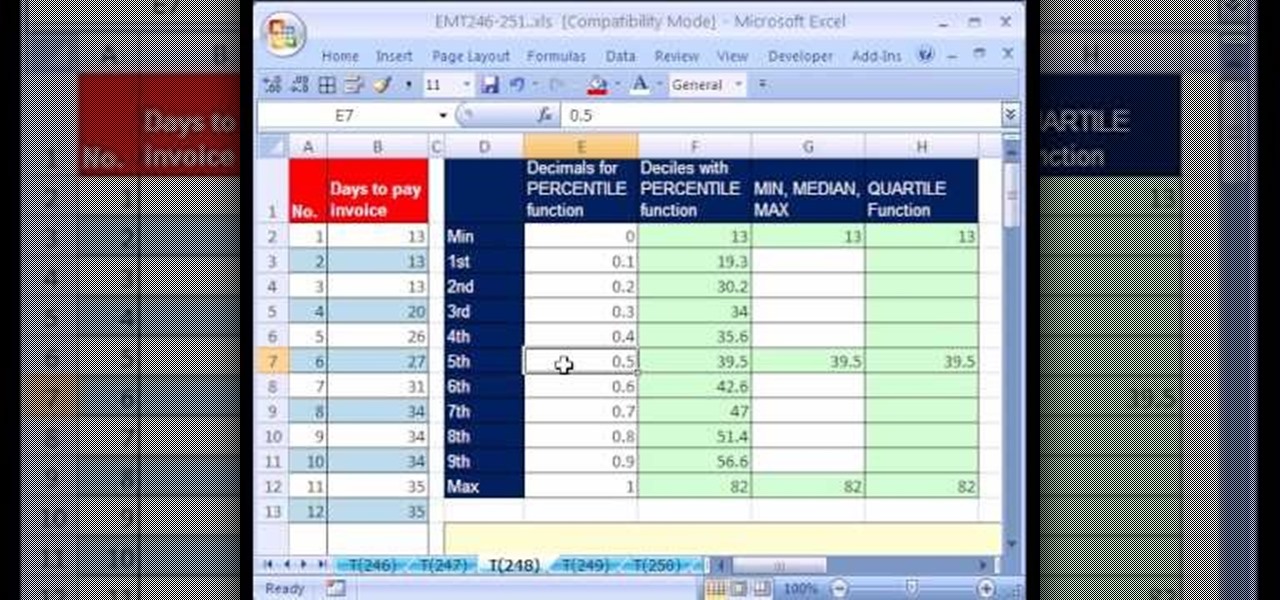
New to Excel? Looking for a tip? How about a tip so mind-blowingly useful as to qualify as a magic trick? You're in luck. In this Excel tutorial from ExcelIsFun, the 248th installment in their series of digital spreadsheet magic tricks, you'll learn how to use the PERCENTILE and QUARTILE functions to calculate percentiles, quartiles and deciles in basic statistics.
Contrary to what most people do, letting your dog stick it's head out the window is not a safe way of transporting your animal! Check out this video for some tips on how to safely travel with your dog.
The majority of Android devices have built-in sensors underneath the hood that measure motion, position, and several environmental parameters that provide data needed to monitor your movements and adjust accordingly.
As the protectors of all things good, the Federal Communications Commission is usually busy behind the scenes pissing off Slim Shady, giving out fines for indecent nipple exposure at certain halftime events, and warning the NSA about losing any "confidential" phone information they steal from us.
Kevin Rose is joined by John Todd, a well known, leading Asterisk expert, to introduce you to the amazing VoIP (Voice over IP) world of Asterisk, the open source voip telephony toolkit. In this episode, Kevin and John take you through the installation and configuration of this powerful tool, and show how it can be used to give anyone complete control over their phone experiences, such as voice over wifi, eliminating phone costs, choosing from hundreds of VoIP providers, creating your own voic...
Any talk about privacy is a complicated (usually) and touchy subject. In today's world, privacy is an ever eroding pleasure to be had. Numerous cases, like the monumental Kat'z vs United States, have been fought to hold on to this right.
A good baseball team can't be good unless all of its players are good. And while every player is important to the team's overall success, the batter is usually the one most closely watched and analyzed.