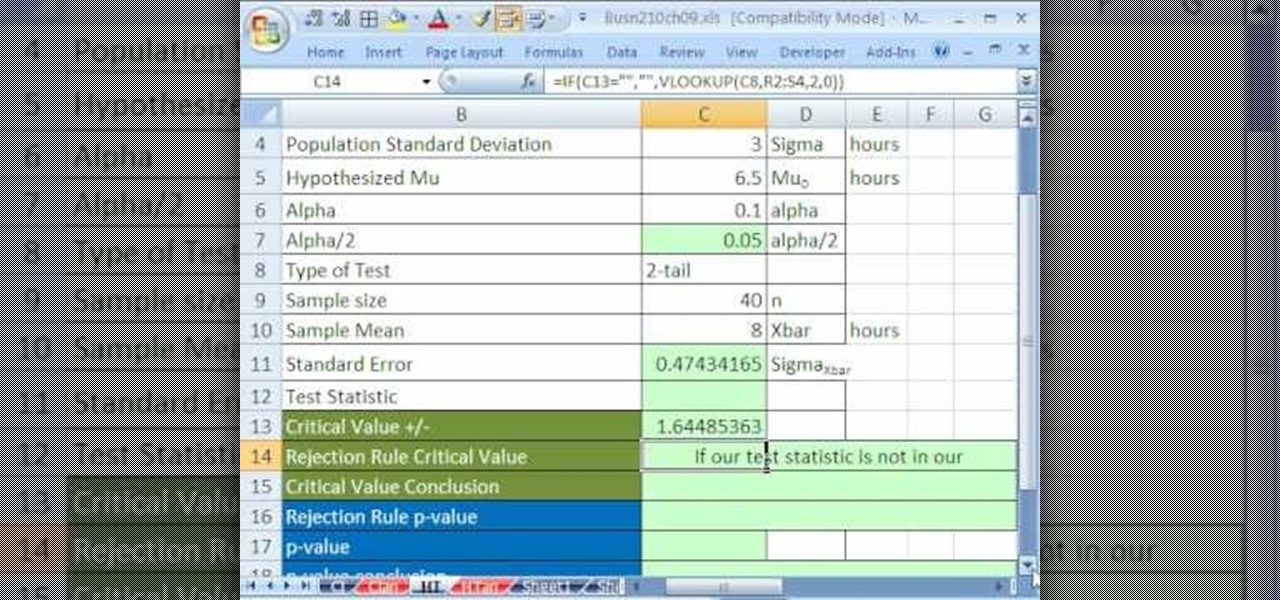
If you use Microsoft Excel on a regular basis, odds are you work with numbers. Put those numbers to work. Statistical analysis allows you to find patterns, trends and probabilities within your data. In this MS Excel tutorial from everyone's favorite Excel guru, YouTube's ExcelsFun, the 47th installment in his "Excel Statistics" series of free video lessons, you'll learn how to use the NORMSINV function for critical values and the NORSDIST function for p-values. Compare building confidence int...
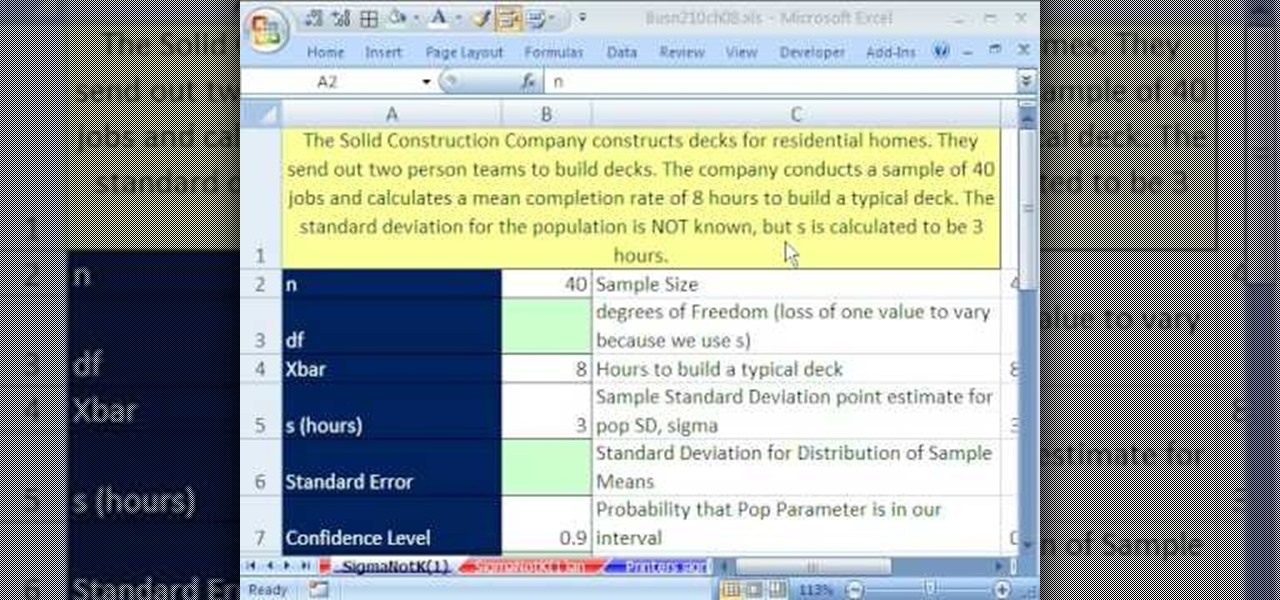
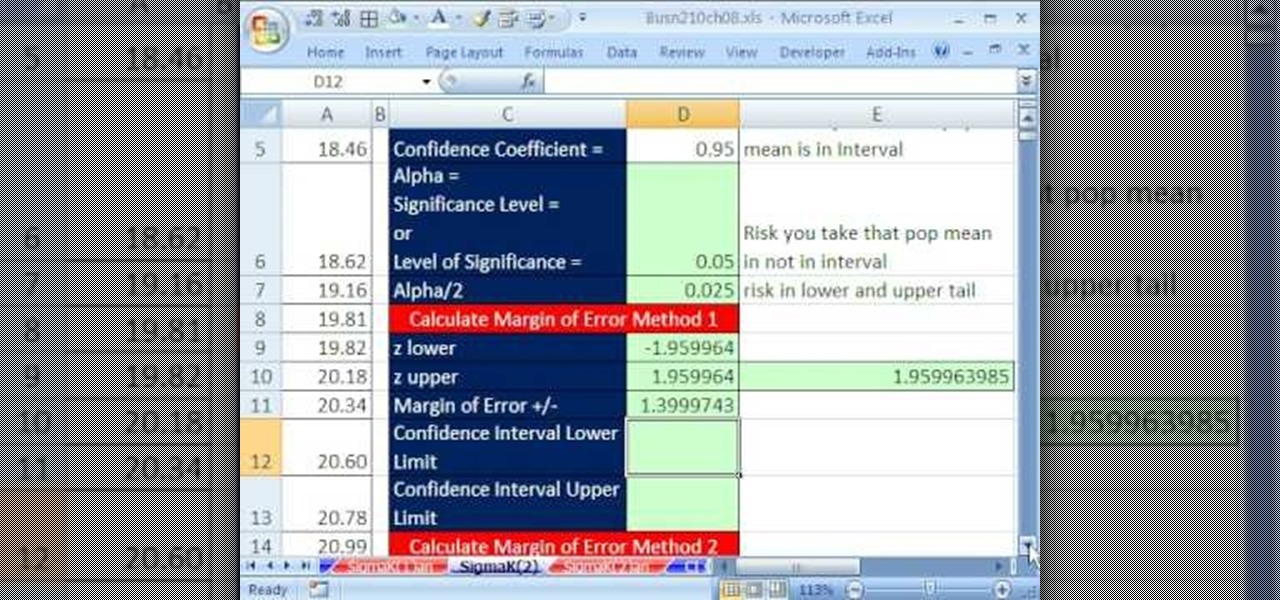
If you use Microsoft Excel on a regular basis, odds are you work with numbers. Put those numbers to work. Statistical analysis allows you to find patterns, trends and probabilities within your data. In this MS Excel tutorial from everyone's favorite Excel guru, YouTube's ExcelsFun, the 82nd installment in his "Excel Statistics" series of free video lessons, you'll learn how to construct confidence intervals when the sigma value (the population's standard deviation) in NOT Known using the TINV...
3,000 soldiers to serve in Africa next year A brigade will deploy to Africa next year in a pilot program that assigns brigades on a rotational basis to regions around the globe, the Army announced in May.

Most women wear the wrong bra size. It's not that we don't care for finding the right one, but rather that all retailers make their bras just a little bit different, and the number + cup size system is more mystifying than helpful.
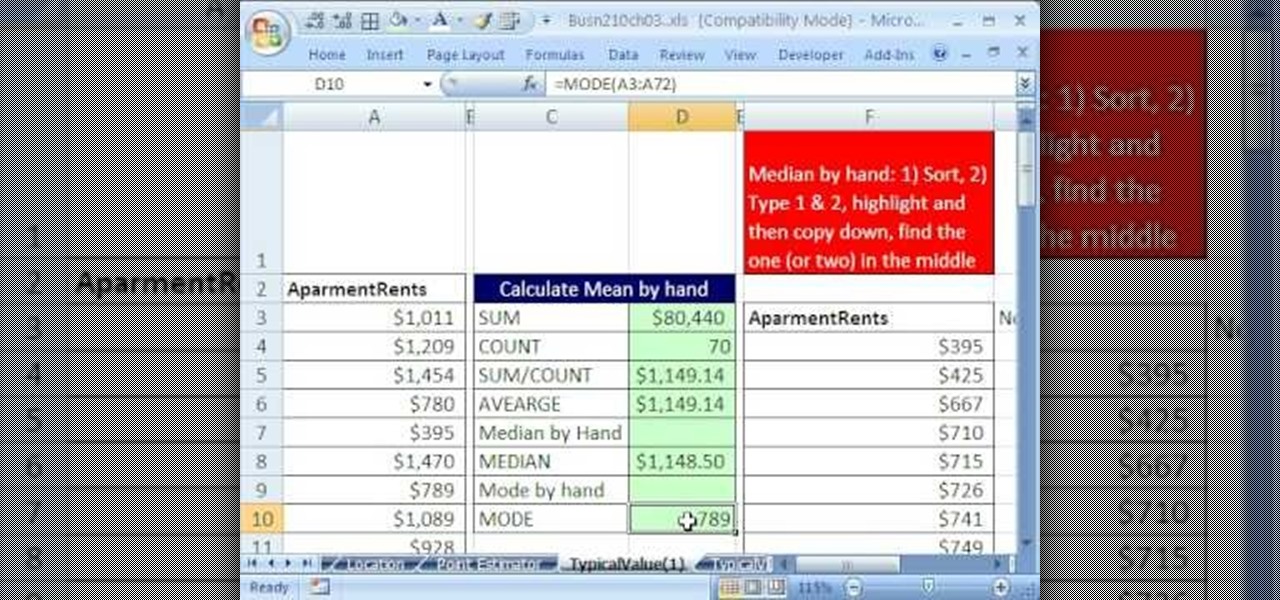
If you use Microsoft Excel on a regular basis, odds are you work with numbers. Put those numbers to work. Statistical analysis allows you to find patterns, trends and probabilities within your data. In this MS Excel tutorial from everyone's favorite Excel guru, YouTube's ExcelsFun, the 34th installment in his "Excel Statistics" series of free video lessons, you'll learn how to use MEAN, MEDIAN, MODE. These measures give us a typical value, a measure of central tendency one value that can repr...
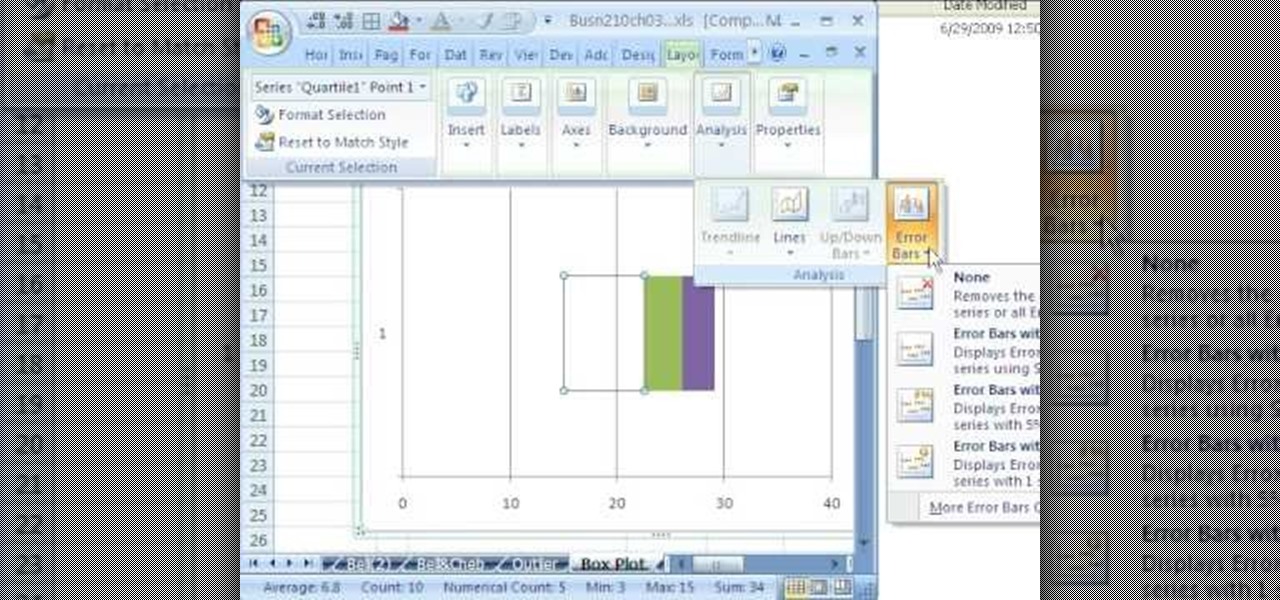
If you use Microsoft Excel on a regular basis, odds are you work with numbers. Put those numbers to work. Statistical analysis allows you to find patterns, trends and probabilities within your data. In this MS Excel tutorial from everyone's favorite Excel guru, YouTube's ExcelsFun, the 49th installment in his "Excel Statistics" series of free video lessons, you'll learn how to find outliers with the +/- 3 Z-score rule and the ABS function. See how to do a box plot by hand and in Excel. For th...

If you use Microsoft Excel on a regular basis, odds are you work with numbers. Put those numbers to work. Statistical analysis allows you to find patterns, trends and probabilities within your data. In this MS Excel tutorial from everyone's favorite Excel guru, YouTube's ExcelsFun, the 38th installment in his "Excel Statistics" series of free video lessons, you'll learn how to use the RANK and PERCENTRANK functions as well as the Data Analysis add-in's Rank & Percentile tools.
If you use Microsoft Excel on a regular basis, odds are you work with numbers. Put those numbers to work. Statistical analysis allows you to find patterns, trends and probabilities within your data. In this MS Excel tutorial from everyone's favorite Excel guru, YouTube's ExcelsFun, the 20th installment in his "Excel Statistics" series of free video lessons, you'll learn how to take raw quantitative (numerical) data and figure out how to group it into classes so that you can have categories an...
If you use Microsoft Excel on a regular basis, odds are you work with numbers. Put those numbers to work. Statistical analysis allows you to find patterns, trends and probabilities within your data. In this MS Excel tutorial from everyone's favorite Excel guru, YouTube's ExcelsFun, the 81st installment in his "Excel Statistics" series of free video lessons, you'll learn how to construct confidence intervals when the sigma (population standard deviation) is known. See how the CONFIDENCE and NO...
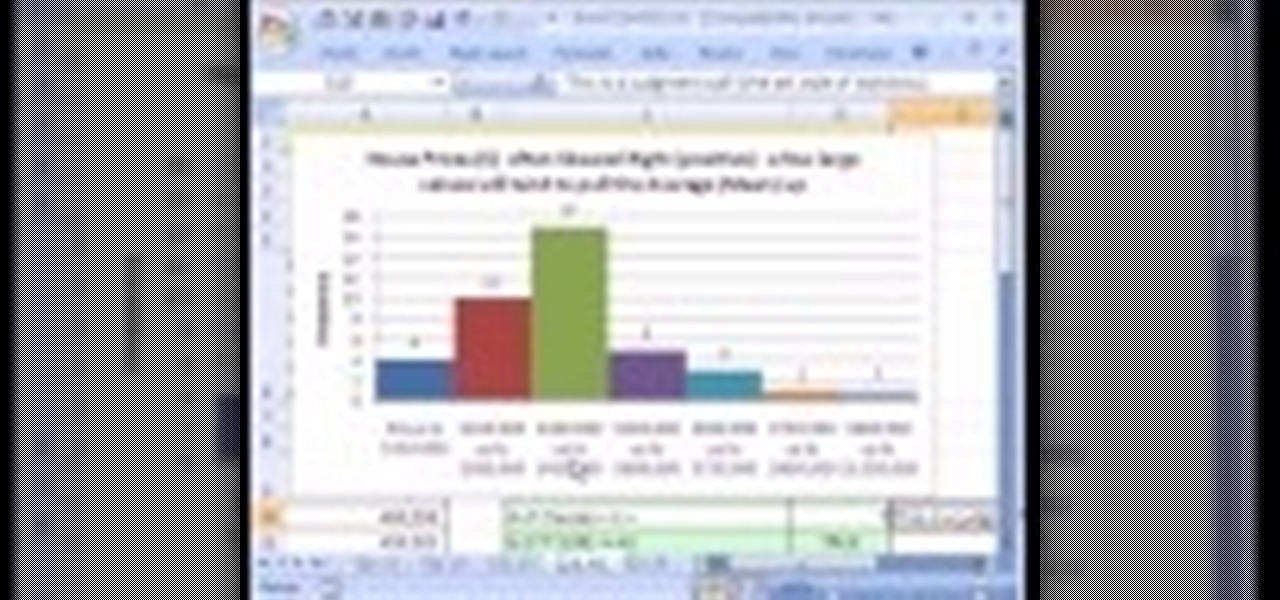
If you use Microsoft Excel on a regular basis, odds are you work with numbers. Put those numbers to work. Statistical analysis allows you to find patterns, trends and probabilities within your data. In this MS Excel tutorial from everyone's favorite Excel guru, YouTube's ExcelsFun, the 23rd installment in his "Excel Statistics" series of free video lessons, you'll learn how to work with skew in histograms for quantitative Data. Learn how to skew left (negative) and skew right (positive) with ...
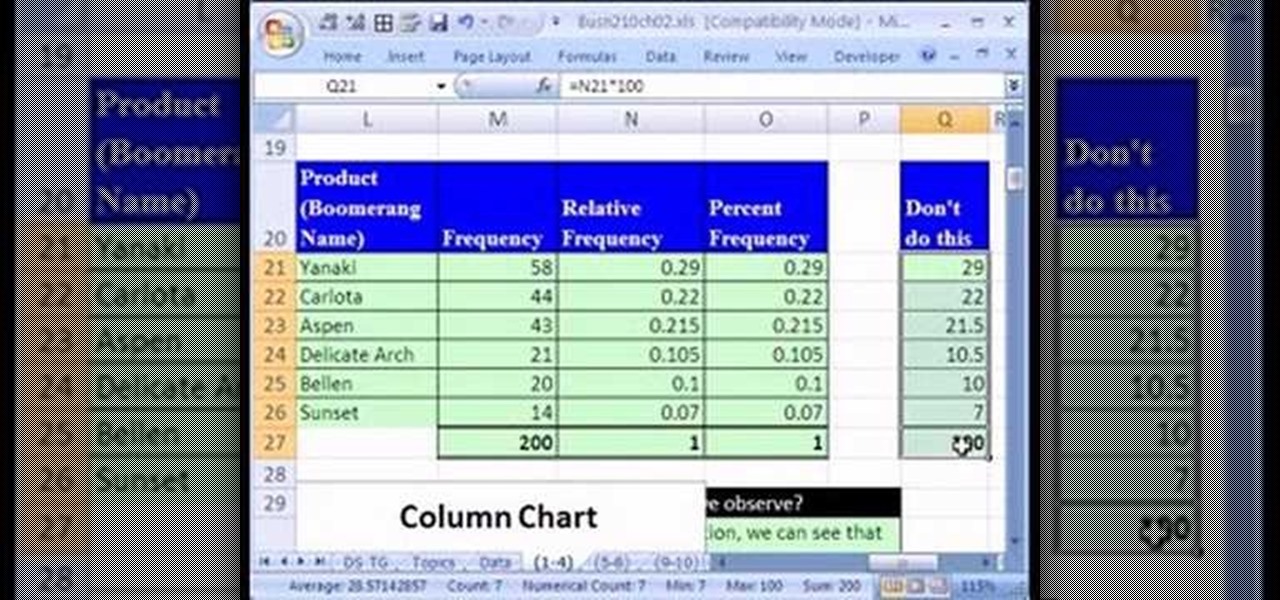
If you use Microsoft Excel on a regular basis, odds are you work with numbers. Put those numbers to work. Statistical analysis allows you to find patterns, trends and probabilities within your data. In this MS Excel tutorial from everyone's favorite Excel guru, YouTube's ExcelsFun, the 14th installment in his "Excel Statistics" series of free video lessons, you'll learn how to create relative & percent & frequency distributions with formulas for categorical data. See, too, how to create a per...
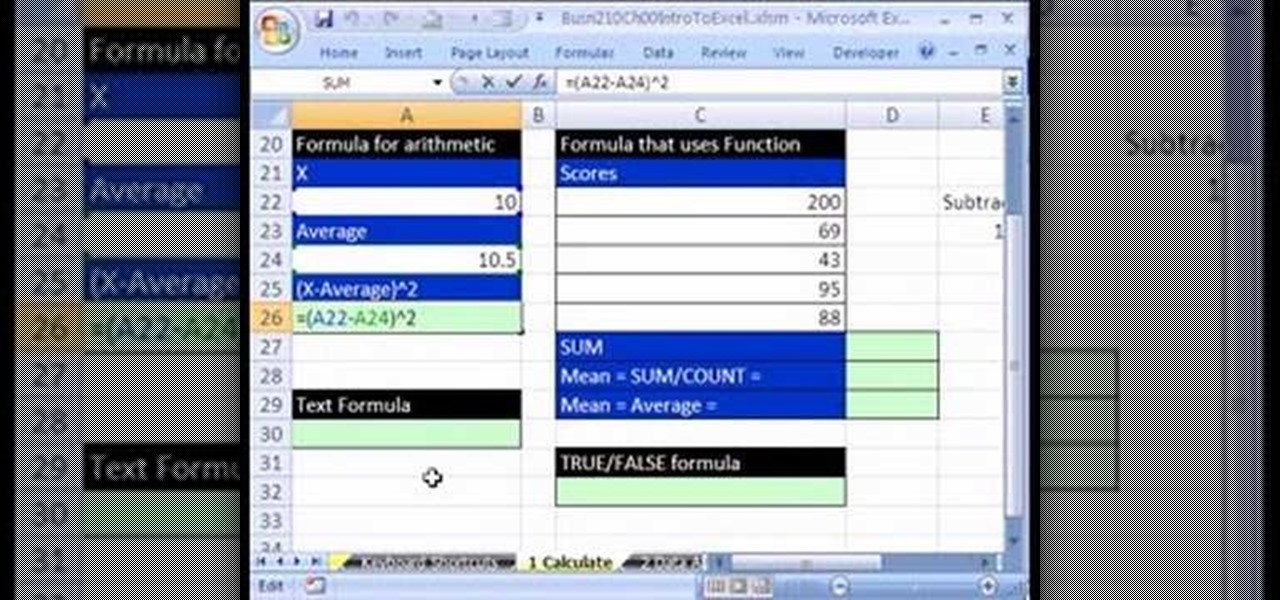
If you use Microsoft Excel on a regular basis, odds are you work with numbers. Put those numbers to work. Statistical analysis allows you to find patterns, trends and probabilities within your data. In this MS Excel tutorial from everyone's favorite Excel guru, YouTube's ExcelsFun, the 2nd installment in his "Excel Statistics" series of free video lessons, you'll learn how to make calculations in Excel using formulas and cell references. Learn about the different Excel Math operators and func...
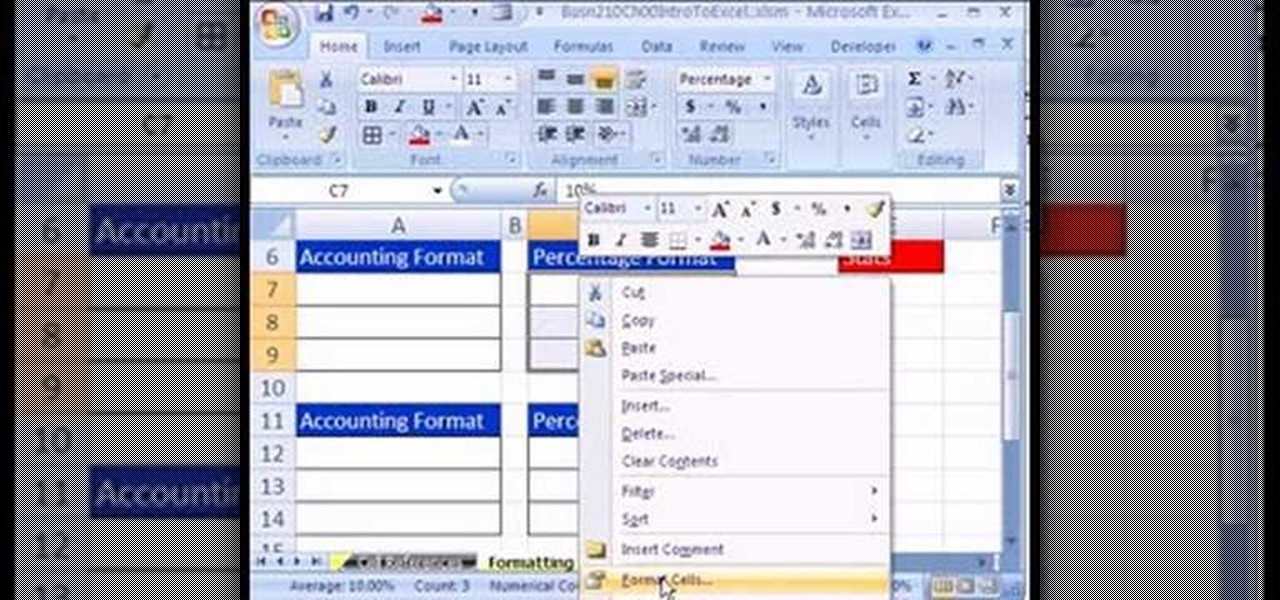
This is the fifth video in the Statistics in Excel. He gives the website address where content can be downloaded. He speaks about the different types of formatting like stylistic and number formatting. He talks about the different formats like accounting and percentage, and how to use both of them. Accounting format is nice because it lines up the decimals nicely. He shows how to apply the accounting format. The percentage format displays the value in as a percentage. He shows you how to appl...
Veronica from Tekzilla teaches you how to monitor network activity on Windows 7. Go to ITSamples and download the Network Activity Indicator program. Install it and run it. This will add a new icon on your system tray. It blinks to reflect incoming and outgoing packets. You can right click to see a more detailed report. You also get statistics and a menu for your network and firewall settings. So to get the popular windows XP type network indicator icon all you need to do is follow the steps ...
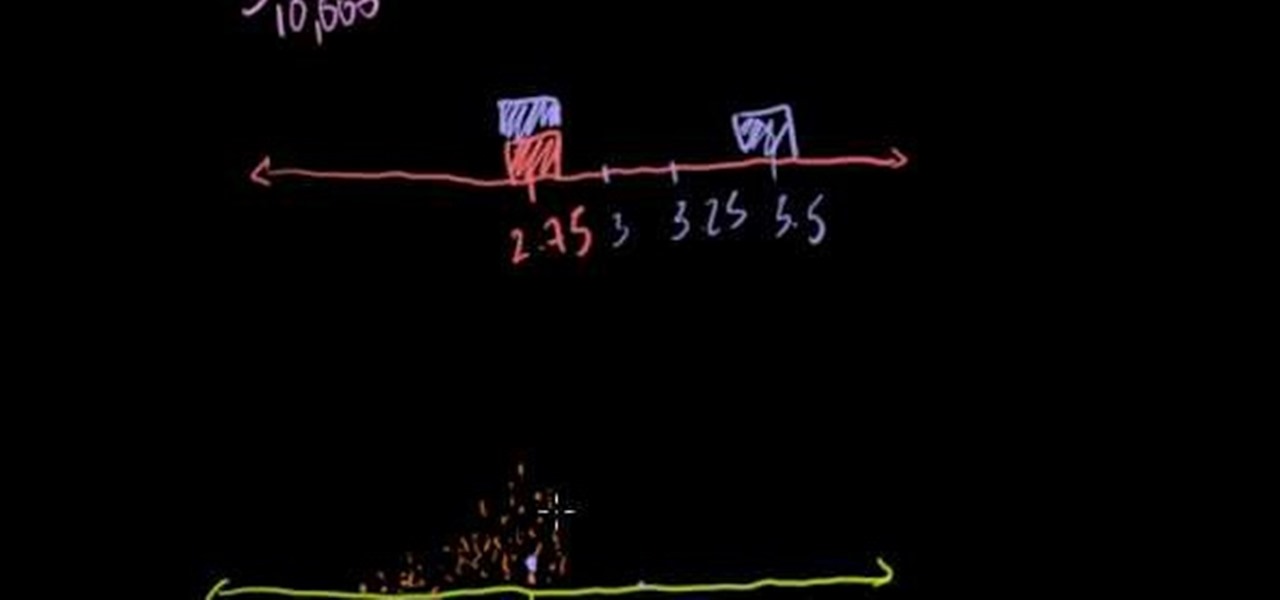
In this tutorial the instructor explains the percentile formula. He says that the percentile formula is used to find the percentile rank of a data point in a group of data. He takes an example that consists of the lengths of puppies. Now he intends to find out the percentile rank of any puppy in the group. He shows that the formulate to compute a percentile rank of a particular puppy is rank R = 100 * (N< + (1/2)N= )/ Nt, where N< is the number of puppies whose length is less that the length ...
Central limit theorum is easily one of the most fundamental and profound concepts in statistics and perhaps in mathematics as a whole. In probability theory, the central limit theorum (CLT) states conditions under which the mean of a suffiently large number of independent random large variables (each with finite means and variance) will be normally distributed, approximately. Huh? If you are having trouble understanding central limit theorum and need help trying to solve it, check out this tu...
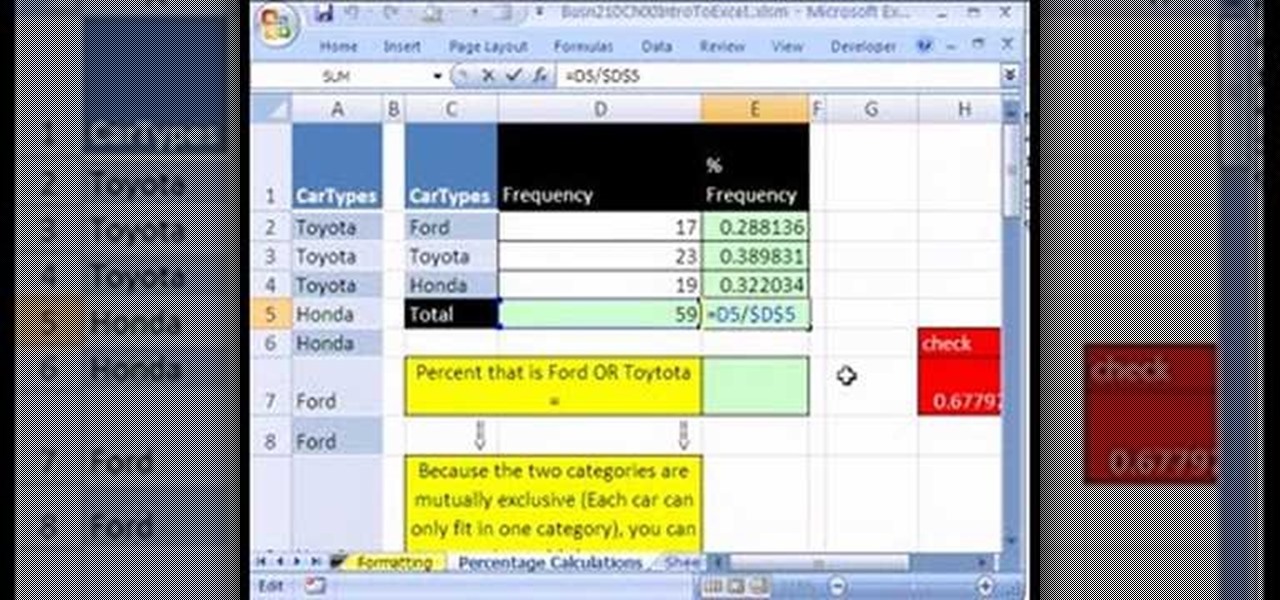
This Excel Statistics series of video shows how to calculate proportions and percentages in Microsoft Excel. This video shows how to do percentage calculations using formulas in Microsoft Excel. To make a formula for a percentage, you need to first make a formula to calculate the total sum of objects you are going to use. To do that, use the sum formula. Now, divide the current object's value with the previously generated sum formula, which gives you the frequency. When you multiply this by 1...
According to a U.S. survey, the crud in our garages is taking up most available floor space. Hence the average North American chucks up to $6500 worth of mostly useless stuff on the floor of the garage, while the $20,000 vehicle sits outside in the cold, rusting. It's time to get our cars back into garages. We spent more than $688 million dollars last year on garage organization and it barely made a dent. If you don't believe me, walk down your street and count the number of houses with cars ...
Last weekend the 2011 World Scrabble Championship was held at the Hilton Hotel in Warsaw, Poland. There were 106 players competing from 44 countries for the $20,000 first place prize and title of World Scrabble Champion.
You would think most people would agree that you shouldn't use your smartphone while driving. Apparently, most people would be liars, according to recent data from the National Safety Council (NSC) and Zendrive.
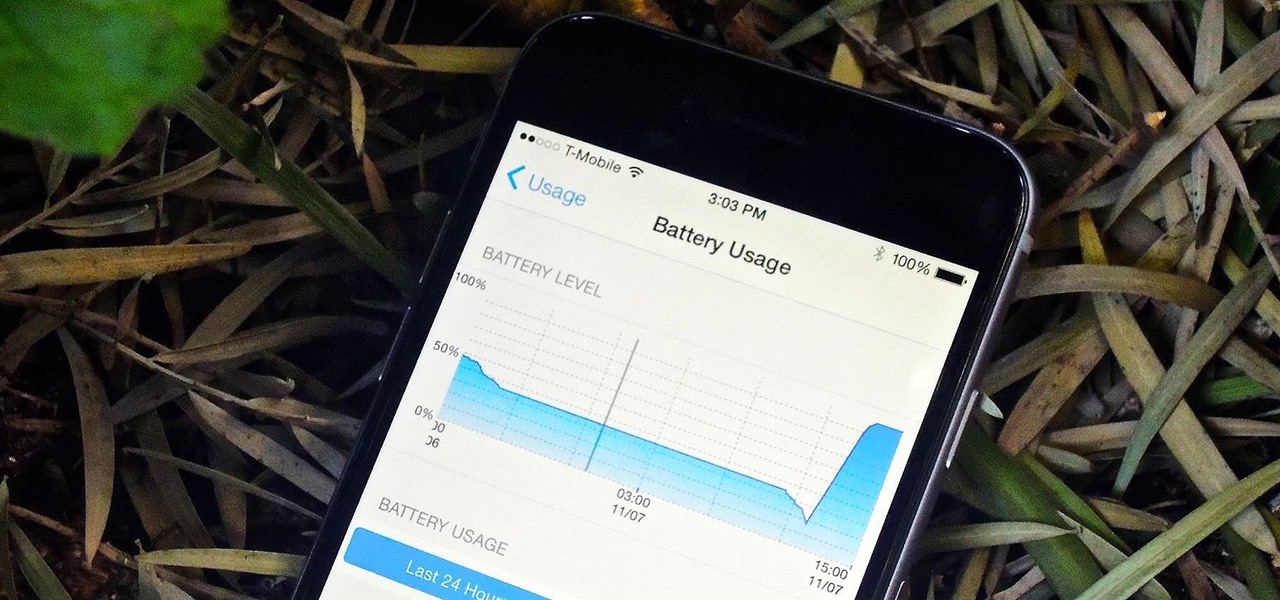
One of my favorite new additions to iOS is the ability to view battery usage stats on a per-app basis, which is helpful in knowing exactly which apps are taking up all of my iPhone's battery life. If you jailbreak iOS 8 on your device, you can take Apple's stock battery stats feature even further to give you details on how those apps are actually using the battery.
With the majority of smartphone carriers no longer offering unlimited data plans for the iPhone, monitoring how much mobile data you use is a key element to saving money on your phone bill.
Drive your way to success on The Saboteur for the Xbox 360. You need to floor the pedal in order to follow Dierker in the sixth mission in the Prologue: A Sunday Drive. It's payback time. Hop into the car with Jules and follow Dierker. Don't get too close to him or his paranoia meter will rise. If it fills up you will be caught and fail the mission. Likewise, if you loose sight of Dierker for too long you will fail the mission. Follow Dierker, just don't follow him too closely. He will lead y...
We knew it was coming, it was just a matter of when. Apple has just announced iOS 11.3, a new update for iPad, iPhone, and iPod touch, and it will include a brand-new set of Animoji for the iPhone X.
Think about how many things you truly throw in the trash, and how many times you empty your trash, only to be taken away by the garbage man and out of your sight. Well, the truth is that its not exactly out of your life. Statistics show that on average each person uses 350 trash bags each year, thats 100 billion all together, and the worst part aboput this fact is that it takes up to 500 years for each of the bags to decay. Thats right in your city at your landfill, bags pileing up, polluting...
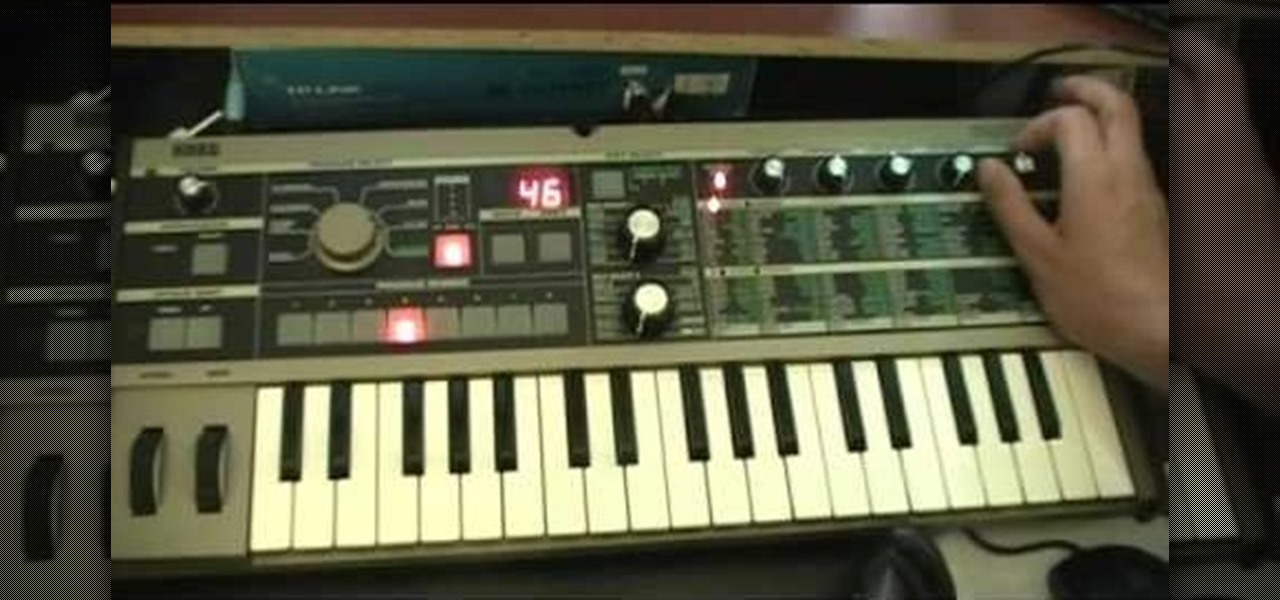
The SAW lead is the most recognizable sound in hardstyle and hardcore electronic music, sounding like a swarm of bees attacking with the precision of an honor guard. Watch this video to learn how to program a patch for a SAW (or sawtooth) lead on a MicroKorg.
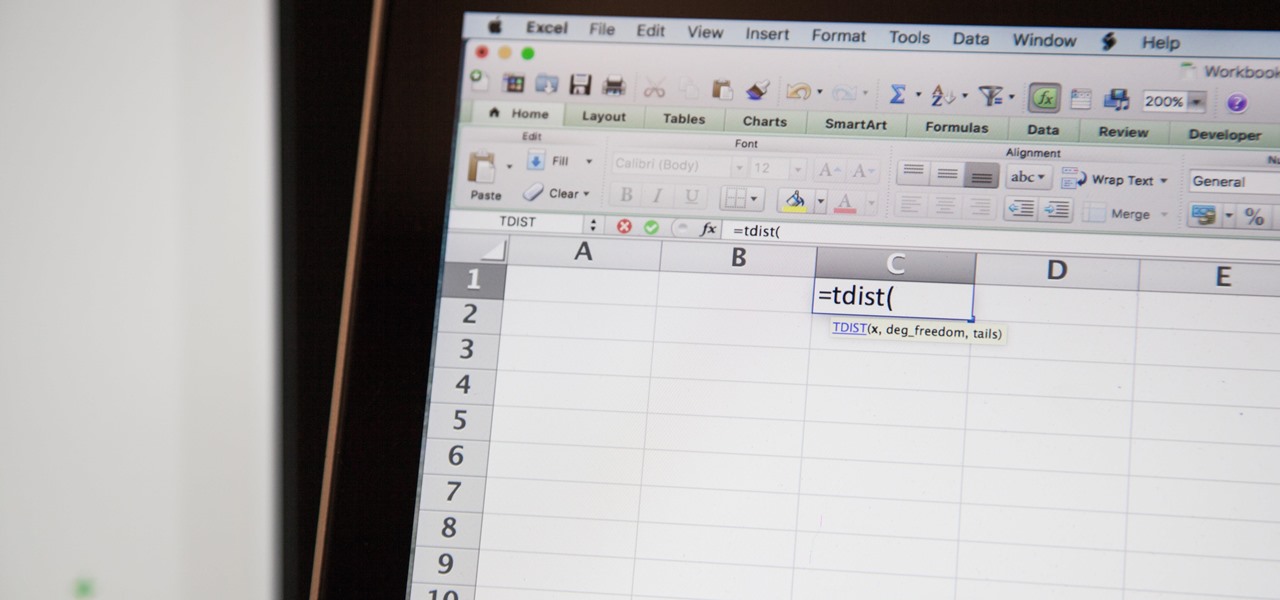
So you need to find the p-value for your hypothesis test. To do so, employ the spreadsheet program Microsoft Excel. Using a simple formula, you can easily determine the p-value for your tests and thereby conclude strong or weak support of the null hypothesis.
In a previous Nurd Rage video (here), Dr. Lithium showed you that pyrolytic graphite was diamagnetic, and that it could be stably levitated over magnets. It was repelled by a magnetic field, and this repulsion was strong enough to levitate it. In this science video tutorial, you'll learn how to levitate plain old pencil lead this time.
Percents are handy for displaying statistics or labeling objects such as sale items in a store, or ingredient labels. However, in a math equation, a percent is a bit difficult to use. Therefore, you will need to convert your percents into an easier type of number form.
Mike 'The Greek' drops by the Film Lab to deliver his own TED talk. The subject: How to make an Best Picture Oscar-winning film (based on numbers and statistics, which he loves maybe even more than money)
Looking to be the talk of the town? Do you love gardening and have some time to spare? Build a garden maze and make your yard the neighborhood sensation.
Systm is the Do-It-Yourself show designed for the common geek who wants to quickly and easily learn how to dive into the latest and hottest tech projects. They will help you avoid pitfalls and get your project up and running fast. In this DIY episode, see how to make an LED blink with an AVR microcontroller.
This four chapter tutorial has proven popular among our staff.
Some drivers give Tesla's Autopilot update released this week rave reviews, after version 8.1 has taken longer than expected to live up to Elon Musk's "smooth as silk" Tweet from earlier this year.
From dynamite to lasers to LEDs, you can make graffiti with a lot of different things. Parisian artist Antonin Fourneau has added water to that list. He created this incredible LED wall that lights up wherever it's touched by water to create what he's dubbed "Water Light Graffiti," which can be simply described as being an LED Buddha Board.
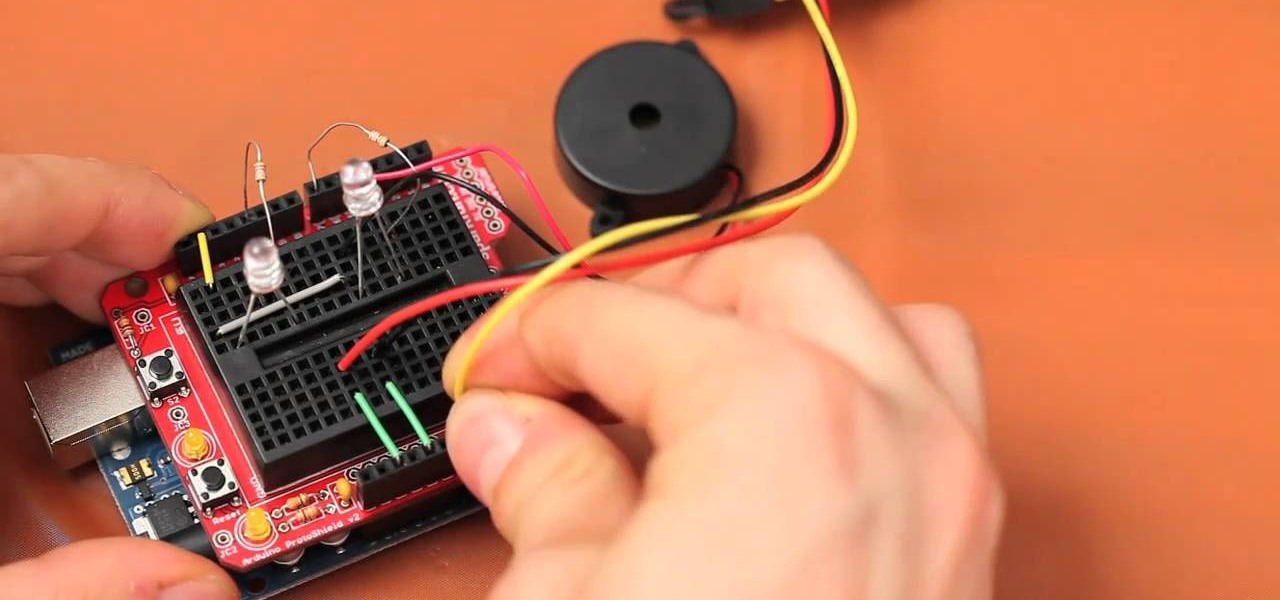
The Arduino Ethernet Shield is a wonderful device for DIY electronics projects, and this project is really creative and awesome. In this video you will learn how to use an Arduino, a promixity sensor, and some LED lights to make a proximity-sensing, LED-lit, evil Jack-o'-Lantern that will terrorize your neighborhood and probably get stolen if you don't watch it like a hawk.
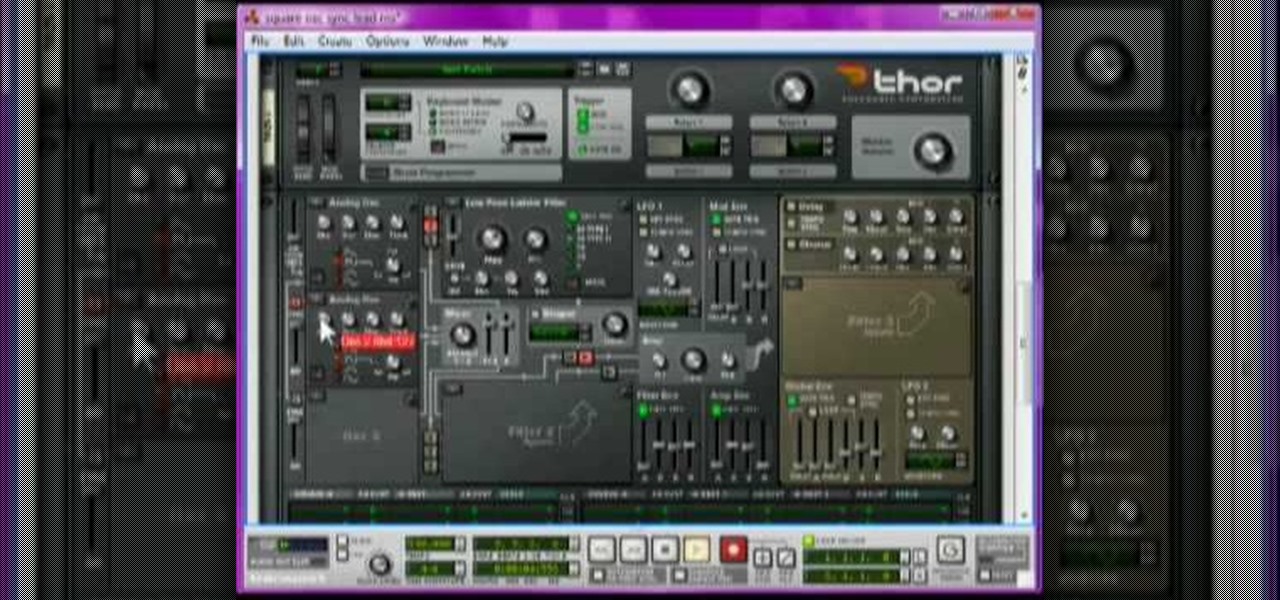
Dance lead synth tracks with oscillator sync (osc sync) effects have powered some of the biggest pop hits of recent years, notably "Sandstorm" by Darude and "Poker Face" by Lady GaGa. In this video you'll learn how to use osc sync and other effects create a dance pop synth lead in Reason 4.
The iconic rap songs that Dr. Dre produced in the early 1990's were the best party rap songs of all time, and many were lead by a high-pitched synth melody that became the hallmark of Dre tunes. Watch this video to learn how to make a similar synth lead effect in Reason.
Give yourself the hottest PS3 controller out there by modding it and adding some sweet LED flashlights. The LEDs will light up in accordance with your game play for a whole new level of enjoyment. This three part video series will take you through the whole process every step of the way, from disassembling to correctly modding it without destroying your controller.
Save tons of money by building your own LED pen that works with a multitouch smart board / whiteboard. You'll also need a WiiMote (Wii Remote) to use in conjunction with your homemade LED pens that you'll be making in this video. To get started with this awesome project, you'll need a 1.5 volt tolerant infrared LED, momentary push button switch, AA-battery case holder, one AA battery, containment unit (Sharpie marker or highlighter body), pliers, superglue, thin copper wire and a soldering iron.