This video will teach and demonstrate the thyroid status assessment and thyroid gland examination in a patient. As a doctor, you will, at some point in your career, need to examine the thyroid gland in a patient's neck, and some other parts of the body which are effected by the thyroid.

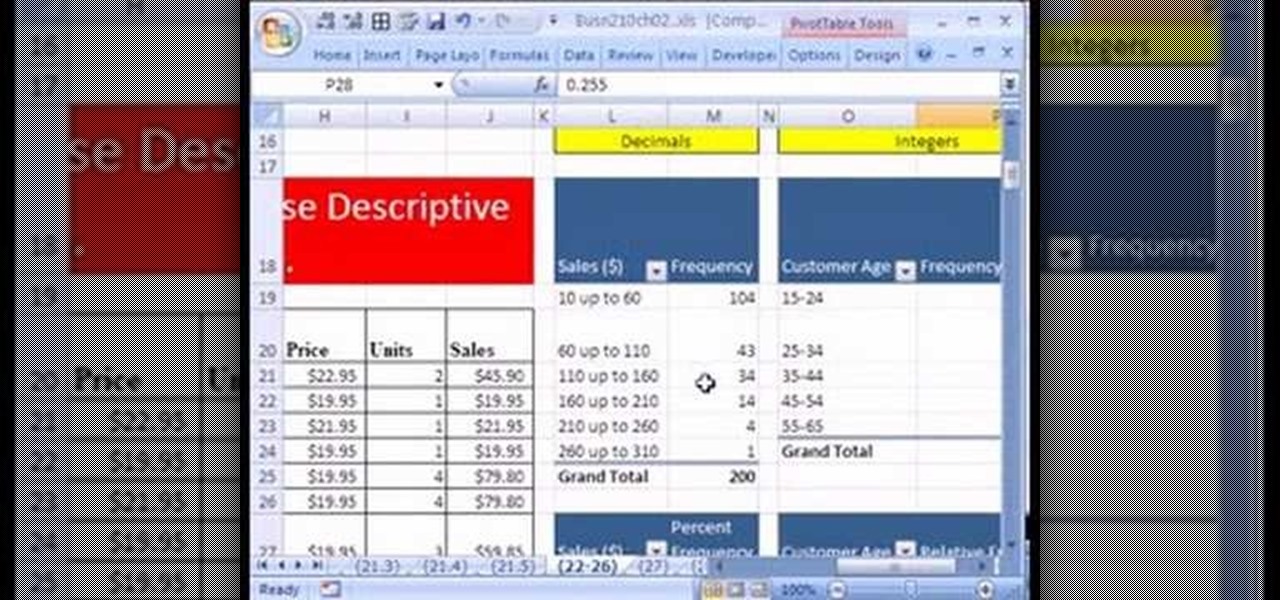
If you use Microsoft Excel on a regular basis, odds are you work with numbers. Put those numbers to work. Statistical analysis allows you to find patterns, trends and probabilities within your data. In this MS Excel tutorial from everyone's favorite Excel guru, YouTube's ExcelsFun, the 24th installment in his "Excel Statistics" series of free video lessons, you'll learn how to create quantitative data frequency distributions with pivot tables. See how to create the correct unambiguous labels ...

If you use Microsoft Excel on a regular basis, odds are you work with numbers. Put those numbers to work. Statistical analysis allows you to find patterns, trends and probabilities within your data. In this MS Excel tutorial from everyone's favorite Excel guru, YouTube's ExcelsFun, the 12th installment in his "Excel Statistics" series of free video lessons, you'll learn how to use Advanced Filter 'Unique Records Only" to extract a list of unique items from a data base, and then use the COUNTI...

Learn how to juggle three balls in this video tutorial! Jason Garfield is one of the best professional jugglers in the world, especially when it comes having a disciplined technical form. He has won the advanced ball competition (5 - 7 balls) several years in a row now. This video is good because it will teach you the best posture and techniques for juggling from day one, so you will ready if you want to move to more advanced patterns.

No one likes having mildew on their belongings, and having it on the wall of your house is even worse it threatens the structure rigidity of the sheetrock. Watch this video to learn how to remove mildew from sheetrock walls.

Staring at computer screens all day means that Americans have worse eyes than ever before. If you want to help our eyes last longer, there are food you can eat to help. This video will give you tips for foods to eat to maintain healthy eyes and good vision.

For better or worse, breasts are probably the female body part that gets the most attention from it's admirers, and as a result women all over the world scramble to make their breasts look larger than they actually are. If you want to do that, this video will show you several trick you can use to do it, from surgical-taping the breasts together to brushing them with bronzer.
If you've ever been taking pictures and have suddenly noticed an odd white line in your pictures, it's called "Spray Light" and it happens when light enters into the viewfinder while the picture is developing. This video teaches you why it's important to use the viewfinder cover or curtain to avoid this serious problem!
This prank is not for the faint of heart. It will hurt your victim a great deal, and likely make them want to visit the same fate upon you. But if you're really trying to find a prank that will make the day of your victim worse, and they like to work on cars, this prank is for you. All you do is wait till your victim is under a car working, then grab a hammer and...
If you use Microsoft Excel on a regular basis, odds are you work with numbers. Put those numbers to work. Statistical analysis allows you to find patterns, trends and probabilities within your data. In this MS Excel tutorial from everyone's favorite Excel guru, YouTube's ExcelsFun, the 92nd installment in his "Excel Statistics" series of free video lessons, you'll learn how to use the TINV and TDIST functions to test a hypothesis.
If you use Microsoft Excel on a regular basis, odds are you work with numbers. Put those numbers to work. Statistical analysis allows you to find patterns, trends and probabilities within your data. In this MS Excel tutorial from everyone's favorite Excel guru, YouTube's ExcelsFun, the 85th installment in his "Excel Statistics" series of free video lessons, you'll learn how to construct confidence intervals for proportions using NORMSINV function and other formulas.
I know it sounds odd, but not every bit of action in a film takes place during the day. Sometimes it's necessary to shoot some scenes at night. This instructional video explores the basics of lighting for a nighttime shoot.
This is an odd how-to on doing up your upper lip with the hippest of new accessories: the mustache.
You've found the perfect photo for your presentation but the background is the wrong color or worse, a cheesy image. Well, if you're creating your presentation in Keynote '08, you can just remove the unwanted background using the alpha tool! See how in this tutorial from Apple.
Been trying for those 6-pack abs without much success? According to oodelboxTV fitness guru Wes Cole, odds are you aren’t working out the correct type of muscle fibers. What? Watch and learn what that means AND how to get a brick belly.
In this video I go over an odd subject, I go over how I Draw a Vampire Child. I make it a relatively simple sketch. Easy things to Draw. Drawing Sites will be great. For more videos go to my blog : http://howtodrawfantasyart.blogspot.com/
Hurricanes are a constant threat to many Americans, and many homes are not constructed properly to be safe from hurricanes. In other countries with less money, these problems are even worse. This video from the International French Red Cross will show you how you can construct a cheap, effective shelter against hurricanes out of concrete and wood. If your home is unsafe and you don't want to retrofit, you might want to consider one of these.
There are few features as difficult to touch up as eyes – and, what's worse, most people have two of them! Learn to retouch eyes with this Photoshop how-to. Whether you're new to Adobe's popular image editing software or simply looking to pick up a few new tips and tricks, you're sure to benefit from this free video tutorial from TutVids. For more information, including step-by-step instructions on how to enhance eyes in a digital photograph, watch this graphic designer's guide.
Ouch! Is your baby's bottom red and sore? Say goodbye to diaper rash with these tried-and-true remedies.
Carolyn Dickerson teaches viewers about the connection between pink eye and makeup! Your pink eye may first start off and seem like a cold in your eye! Sometimes you may not know which pink eye you have. If the week progresses and your pink eye does not get any better, then you do not have a viral pink eye! It will continue to get worse if your eye does not drain properly! First, you can use sulfur based drops but this may be too much. You can also use a oral antibiotic! Swelling, draining an...
robichaudd teaches you how to simplify square roots. When you're dealing with variables, even powers and you want to find out the square root of it, you follow the process. Divide the power by the root, which is two, because it's a square root, that gives you what comes out. If we have square root of x squared, the result would be x. So the square root of x to the 6 is x cubed. You simply divide the power by two, since we are dealing with square root. Then square root of 36 times x square is ...
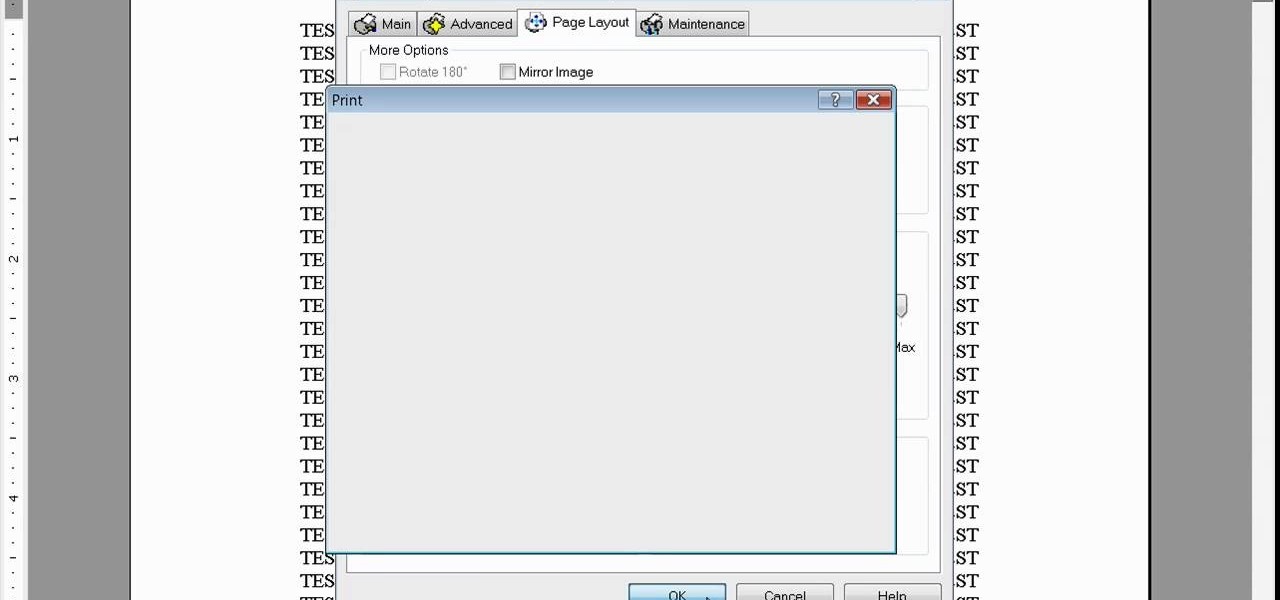
Learn how to print double-sided and reverse printing order in Microsoft Word. * Go to the Start menu and open Microsoft Word.
Step away from the tequila shooters and stop the morning-after agony before it starts. You Will Need
Watch this video tutorial to learn how to prevent swimmer's ear. Don't let this painful infection of the ear canal keep you out of the water! A few simple precautions can combat the excessive moisture that causes bacteria to fester.
Living within your means can be done. You don't want to be a slave to the credit card company, do you? Learn what to do to stay out of credit card debt. This how to video will give you the tips. Credit card debt is a slippery slope.
Nothing is worse than having a contact slide under your eyelid. Okay, there are worse things. But this is one you easily can avoid. Check out this Howcast video tutorial on how to put in and remove contact lenses.
Whether you live in foggy California or icy Massachusetts, you've more than likely struggled with a cloudy, vision-impairing window that makes even the shortest commute impossible.
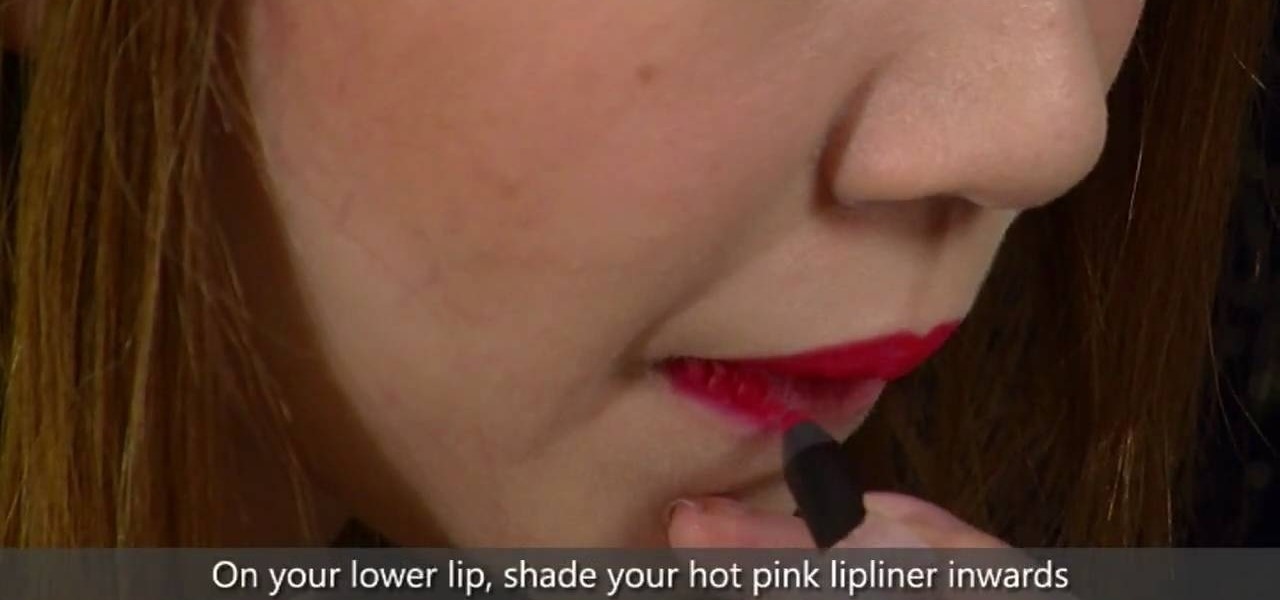
During the Fall 2010 runway shows there were a bunch of crazy makeup looks, but perhaps the most unique look was the two-tone lipstick worn by models on the Nanette Lepore catwalk.
These hot dog cutting projects are the perfect "crafts" to practice on a rainy day. From making spiny hot dog balls to an octopus with funny curled tentacles, these hot dog projects are a delight to make and to eat, since you'll be deep frying them.
We always cringe when we see that a recipe calls for sundried tomatoes. Not that we have anything against tomatoes, but the sundried and preserved kind is all wrinkly, odd tasting, and too sterile. These oven-dried tomatoes, however, are incredibly delicious.
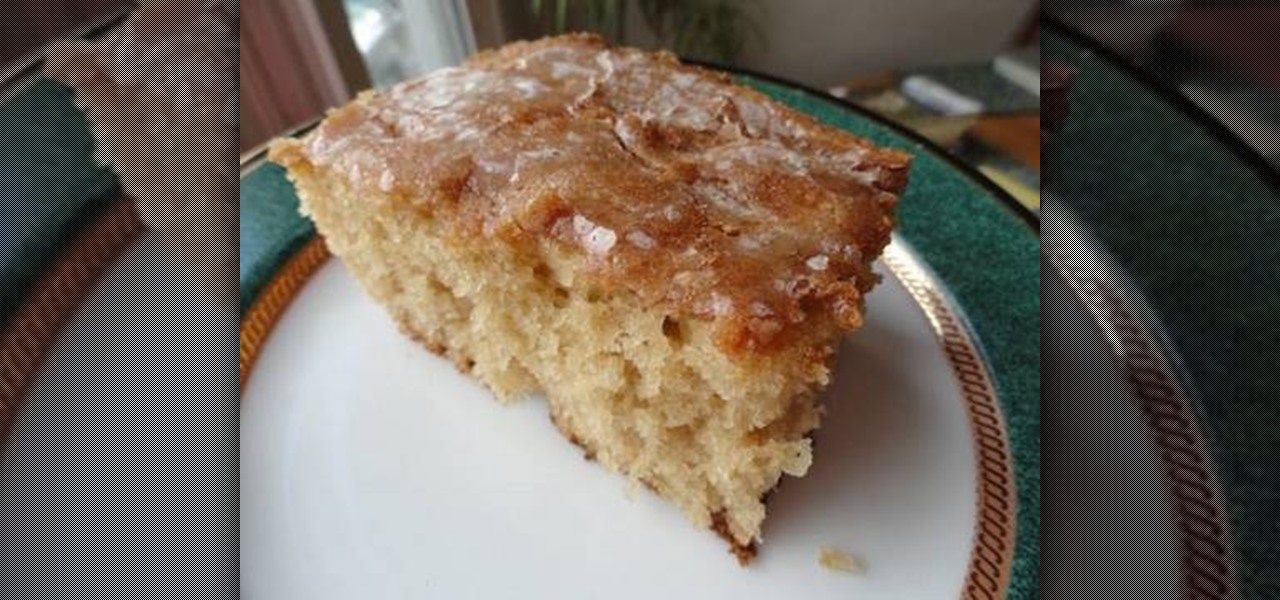
Root beer has a bunch of yummy functions, though usually they involve ice cream sodas. But there's more than just one way to enjoy this delicious carbonated drink. It may seem odd at first, but you can actually use root bear to create a glaze for cakes.
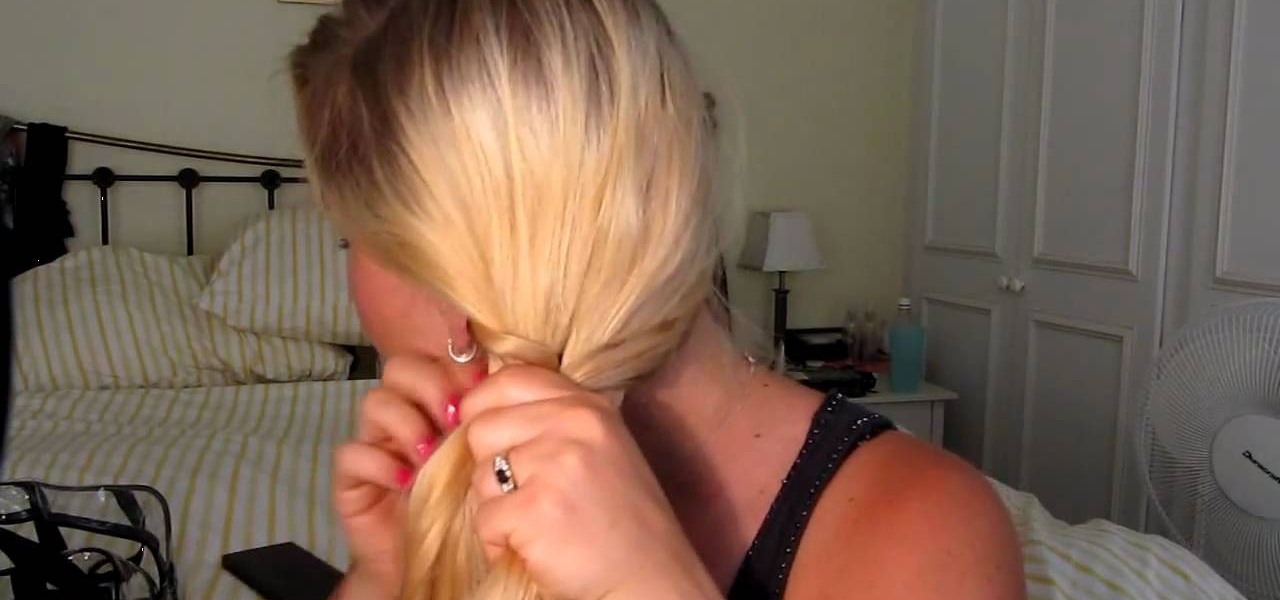
It's pretty odd that summer's hottest braided hairstyles are modeled after fish tails, given that fish don't possess much hair of their own. Either way, the fishtail braid/plait is a sexy look for everyone, especially adult women who want to wear braids without looking like Pippi Longstocking.
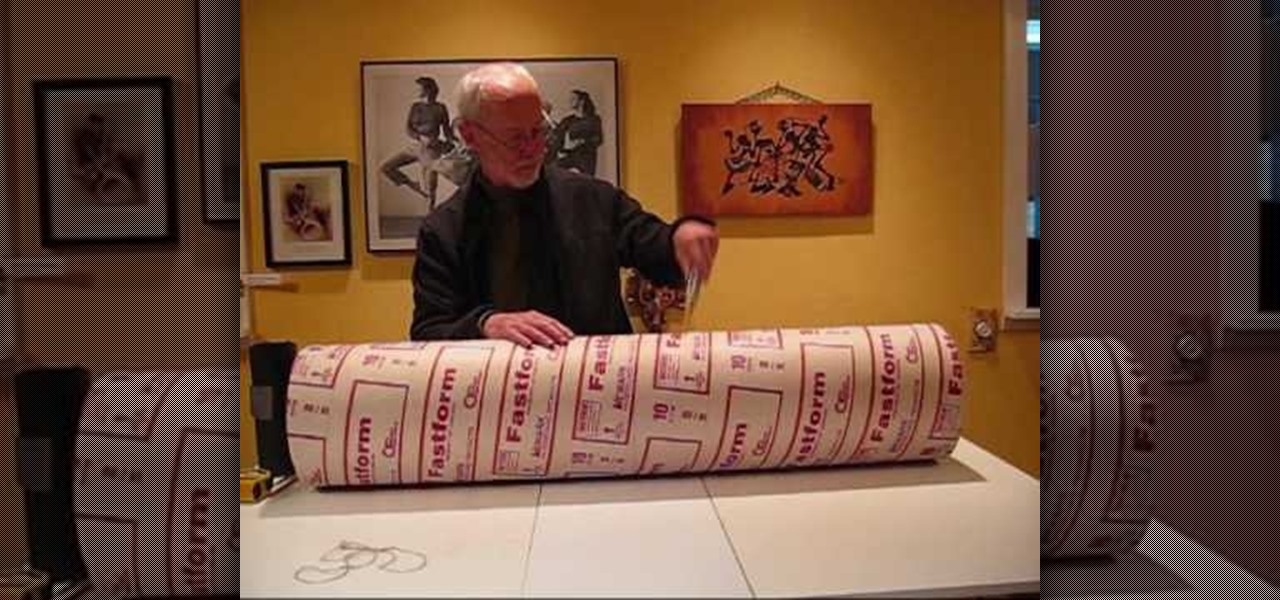
Having a congo drum there for those impromptu African dance groove sessions at your pad is a smart idea, but authentic drums are quite costly.
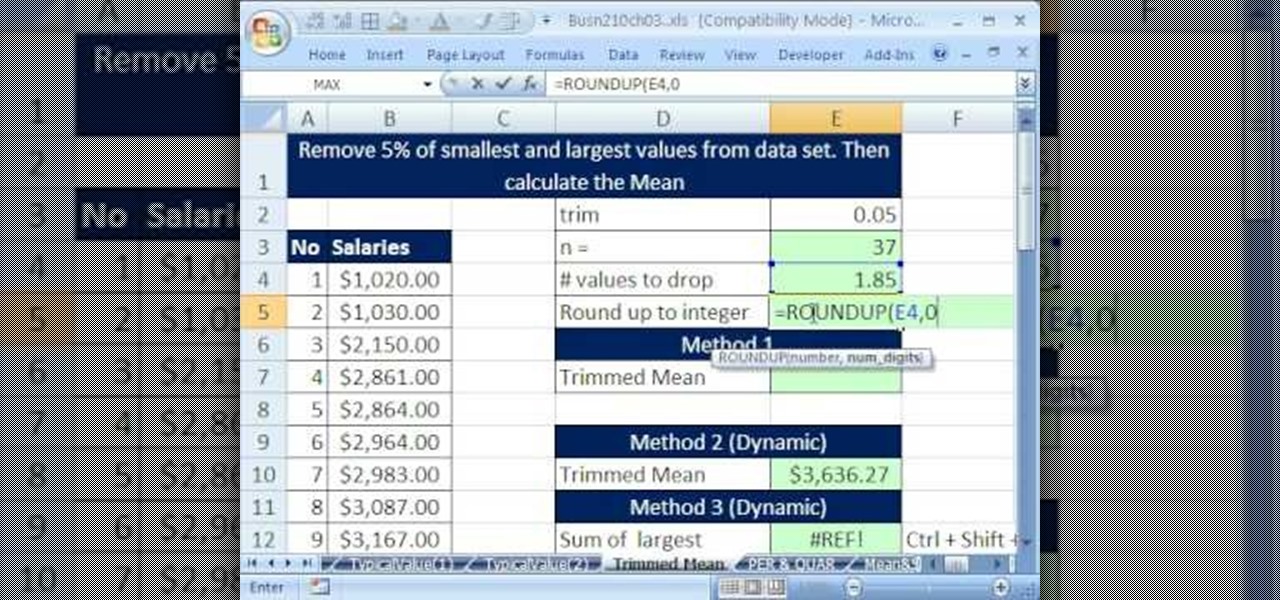
If you use Microsoft Excel on a regular basis, odds are you work with numbers. Put those numbers to work. Statistical analysis allows you to find patterns, trends and probabilities within your data. In this MS Excel tutorial from everyone's favorite Excel guru, YouTube's ExcelsFun, the 36th installment in his "Excel Statistics" series of free video lessons, you'll learn how to calculate a trimmed mean, which is used when there are extreme values in the data set that might skew the mean.
If you use Microsoft Excel on a regular basis, odds are you work with numbers. Put those numbers to work. Statistical analysis allows you to find patterns, trends and probabilities within your data. In this MS Excel tutorial from everyone's favorite Excel guru, YouTube's ExcelsFun, the 39th installment in his "Excel Statistics" series of free video lessons, you'll learn about variability (or dispersion or spread). Create an X-Y Scatter Diagram chart showing data points and the mean.
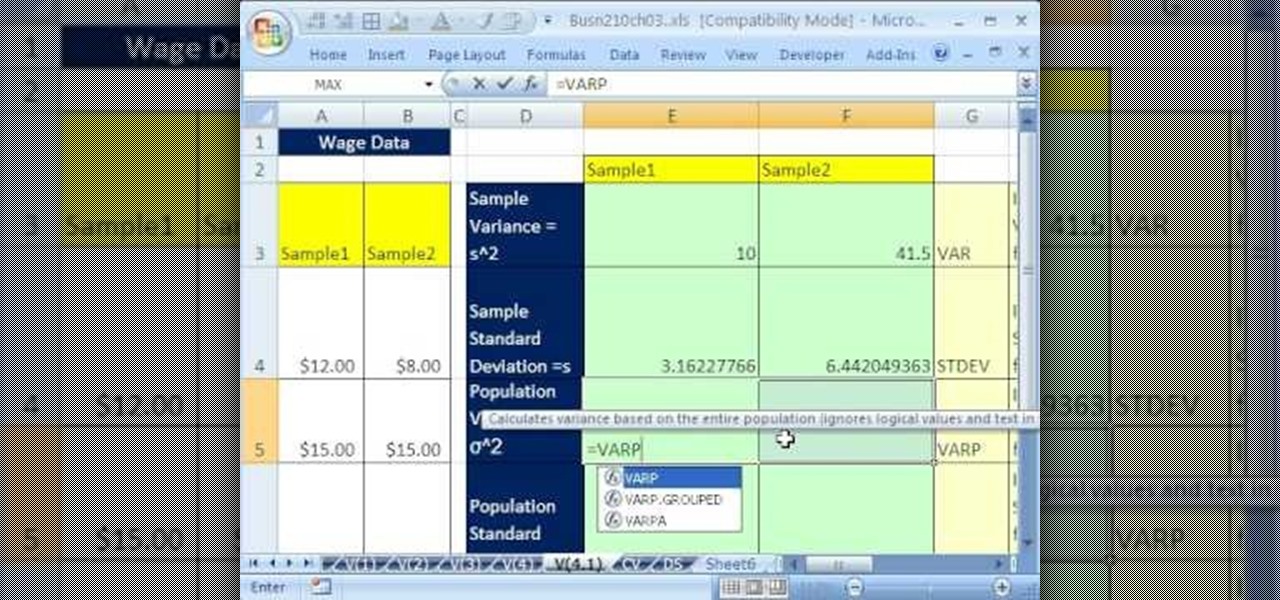
If you use Microsoft Excel on a regular basis, odds are you work with numbers. Put those numbers to work. Statistical analysis allows you to find patterns, trends and probabilities within your data. In this MS Excel tutorial from everyone's favorite Excel guru, YouTube's ExcelsFun, the 41st installment in his "Excel Statistics" series of free video lessons, you'll learn how to calculate deviations, variance and standard deviation for a sample and a population using Excel tables and the VAR, S...
If you use Microsoft Excel on a regular basis, odds are you work with numbers. Put those numbers to work. Statistical analysis allows you to find patterns, trends and probabilities within your data. In this MS Excel tutorial from everyone's favorite Excel guru, YouTube's ExcelsFun, the 32nd installment in his "Excel Statistics" series of free video lessons, you'll learn how to group when the quantitative data are whole numbers, integers or discrete data and how to group when the quantitative ...
If you use Microsoft Excel on a regular basis, odds are you work with numbers. Put those numbers to work. Statistical analysis allows you to find patterns, trends and probabilities within your data. In this MS Excel tutorial from everyone's favorite Excel guru, YouTube's ExcelsFun, the 25th installment in his "Excel Statistics" series of free video lessons, you'll learn how to create quantitative data percent & relative frequency distributions with pivot tables. Also see how to create a histo...
If you use Microsoft Excel on a regular basis, odds are you work with numbers. Put those numbers to work. Statistical analysis allows you to find patterns, trends and probabilities within your data. In this MS Excel tutorial from everyone's favorite Excel guru, YouTube's ExcelsFun, the 22nd installment in his "Excel Statistics" series of free video lessons, you'll learn how to create a percent (%) cumulative frequency distribution with formulas, a histogram and an ogive chart. See how to add ...
If you use Microsoft Excel on a regular basis, odds are you work with numbers. Put those numbers to work. Statistical analysis allows you to find patterns, trends and probabilities within your data. In this MS Excel tutorial from everyone's favorite Excel guru, YouTube's ExcelsFun, the 15th installment in his "Excel Statistics" series of free video lessons, you'll learn how to use create a frequency distribution, relative frequency distribution, percent frequency distribution and pie chart wi...